


In modern software architecture, understanding how code interacts with physical infrastructure is critical. A UML Deployment Diagram provides the blueprint for this interaction. It visualizes the physical nodes where software artifacts reside and how they communicate. This guide explores the mechanics, notation, and practical application of deployment diagrams without relying on specific tooling or marketing fluff.
🧩 What Is a Deployment Diagram?
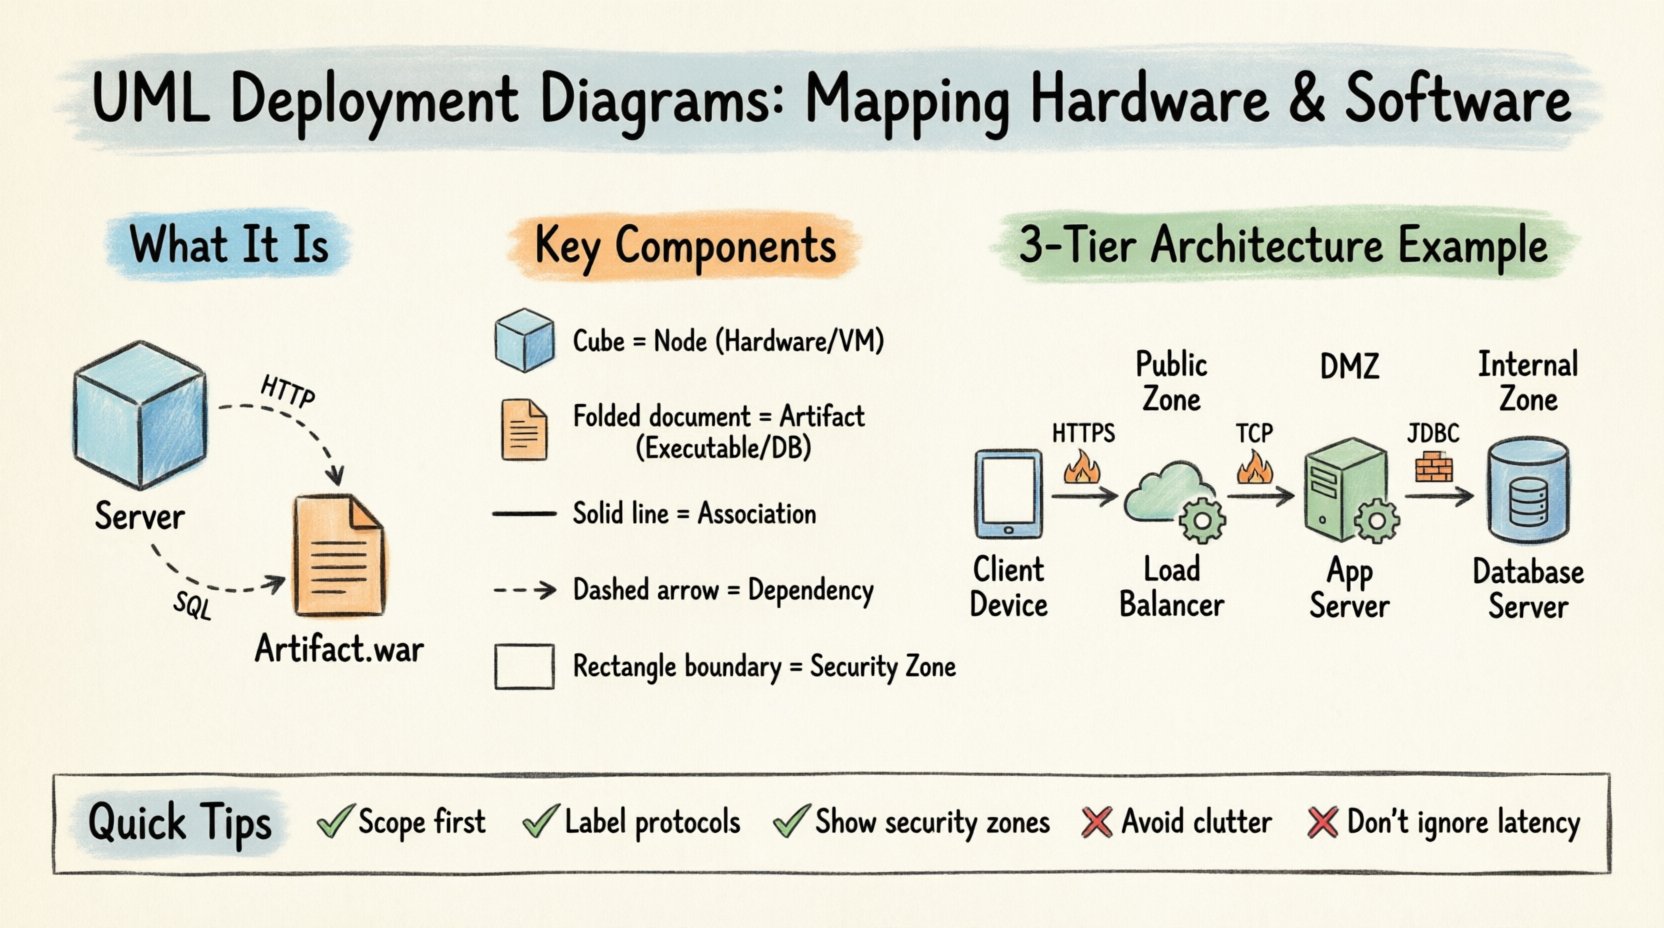
A Deployment Diagram is a static structure diagram in the Unified Modeling Language (UML). It describes the physical architecture of a system. Unlike Class Diagrams that focus on logic, or Sequence Diagrams that focus on flow, the Deployment Diagram focuses on topology. It answers questions about where components live.
- Hardware Representation: Servers, routers, workstations, and mobile devices.
- Software Representation: Executables, libraries, databases, and operating systems.
- Connectivity: The network links that allow these entities to exchange data.
This diagram serves as a communication bridge between developers, system architects, and operations teams. It ensures everyone agrees on the environment before implementation begins.
🔑 Key Components and Notation
To read or create these diagrams effectively, one must understand the standard symbols used in the UML specification. These symbols are universal and do not depend on proprietary software.
🖥️ Nodes (Computational Resources)
The primary building block is the Node. In UML notation, a node is represented by a 3D cube. It represents a computational resource that can host artifacts.
- Device: A node that is a physical hardware device. Examples include laptops, servers, or mobile phones.
- Execution Environment: A node that provides an environment for execution. Examples include an operating system, a virtual machine, or a database management system.
- Artifact: A physical representation of software. This includes executables, files, or data stores.
📄 Artifacts
Artifacts are the software items deployed onto the nodes. They are depicted as a document icon (a rectangle with a folded corner).
- Executable Files: The compiled code that runs on the server.
- Libraries: Shared code modules required by the application.
- Databases: Storage structures residing on a specific node.
- Configuration Files: Settings that define how the software behaves in that environment.
🔗 Communications Paths
Nodes must communicate to function as a system. The lines connecting them represent the medium of communication.
- Association: A simple line showing that a connection exists.
- Dependency: A dashed line with an arrow indicating that one node requires another.
- Message Flow: An arrow showing the direction of data transfer.
🛠️ Building Blocks: Nodes and Artifacts
Constructing a diagram requires careful selection of nodes and artifacts. Granularity is key. Too much detail creates clutter; too little creates ambiguity.
Physical vs. Logical Nodes
Deployment diagrams can be viewed at two levels of abstraction.
- Physical: Represents actual hardware. You might see a specific rack server, a firewall box, or a client workstation.
- Logical: Represents functional groupings. You might see a “Web Tier” or a “Data Tier” without specifying the exact hardware.
Choosing the right level depends on the audience. Operations teams need physical details. Developers might prefer logical groupings.
Mapping Artifacts to Nodes
Artifacts must be placed on the nodes they inhabit. This relationship is often shown using a solid line or a nesting relationship. The artifact is drawn inside the node or connected to it.
Consider a standard web application structure:
- Web Server Node: Hosts the HTML files, CSS, and JavaScript.
- Application Server Node: Hosts the backend logic (e.g., Java archives or Python scripts).
- Database Server Node: Hosts the SQL files or NoSQL data stores.
🔗 Connections and Dependencies
Connectivity defines the system’s capability. The lines between nodes are not just lines; they represent protocols and constraints.
Network Protocols
While UML does not enforce protocol names on lines, it is best practice to label them. This clarifies how data moves.
| Connection Type | Common Protocol | Use Case |
|---|---|---|
| HTTP/HTTPS | Web Requests | Browser to Server |
| SQL/JDBC | Database Queries | App Server to DB Server |
| Socket/SSH | Secure Shell | Admin to Server |
| File Transfer | FTP/SFTP | Backup Systems |
Dependency Relationships
Not all connections are equal. A dependency relationship implies that the source node cannot function without the target node. For example, the Application Server depends on the Database Server. If the database is down, the application cannot process transactions.
📝 Step-by-Step Construction Guide
Creating a deployment diagram requires a methodical approach. Follow these steps to ensure accuracy and clarity.
1. Identify the Scope
Define the boundaries of the system. Are you diagramming the entire enterprise or just a specific microservice? Scope dictates the level of detail.
2. Inventory Hardware Resources
List all physical devices involved. Include:
- Application Servers
- Load Balancers
- Firewalls
- Client Devices
- Network Switches
3. Inventory Software Artifacts
List the software components that need deployment. Include:
- Operating System Version
- Middleware (e.g., Web Server software)
- Application Executables
- Database Instances
4. Define Relationships
Draw the lines connecting the nodes. Specify the protocol if known. Ensure arrows point in the direction of the primary data flow.
5. Review for Completeness
Check that every artifact has a home. Check that every node is connected to the rest of the network logically. Verify that security zones are represented.
🎨 Visual Standards and Layout
A diagram is useless if it is unreadable. Adhering to visual standards improves comprehension.
- Consistency: Use the same icon style for similar nodes across the diagram.
- Spacing: Leave whitespace between nodes to avoid overlapping lines.
- Grouping: Use sub-nodes or boundaries to group related components.
- Labeling: Keep labels short. Use text boxes for longer descriptions if necessary.
Security Zones
Security is a critical aspect of deployment. Use boundaries to denote security zones.
- Public Zone: Accessible from the internet. Contains load balancers and web servers.
- DMZ (Demilitarized Zone): Semi-trusted. Contains proxies or gateways.
- Internal Zone: Trusted. Contains databases and backend logic.
Visualizing these zones helps security teams identify potential vulnerabilities in the architecture.
🚫 Common Pitfalls to Avoid
Even experienced architects make mistakes. Avoid these common errors to maintain diagram integrity.
- Overcomplication: Including every microservice in a single diagram makes it unreadable. Split diagrams by function or tier.
- Ignoring Latency: Failing to show network distance. A local database is different from a remote cloud database.
- Static State: Deployment diagrams change. Ensure they are updated when infrastructure changes. An outdated diagram is worse than no diagram.
- Missing Hardware: Focusing only on software. Hardware limitations (CPU, RAM) often dictate software performance.
- Unclear Labels: Using acronyms that the audience does not understand. Define terms if necessary.
☁️ Cloud vs. On-Premise Representations
Modern architecture often involves hybrid environments. Representing cloud resources requires specific considerations.
Cloud Nodes
In cloud environments, hardware is abstracted. A “Server” might be a virtual instance.
- Virtual Machines: Represented as nodes with a cloud icon or label.
- PaaS (Platform as a Service): Represented as execution environments without specifying the OS.
- SaaS (Software as a Service): Represented as external artifacts accessed via the network.
Network Topology
Cloud diagrams often include regions and availability zones.
- Region: A geographic area containing multiple data centers.
- Availability Zone: Distinct data centers within a region.
Depicting these ensures the system is designed for redundancy and disaster recovery.
🔄 Integration with Other UML Models
A Deployment Diagram does not exist in isolation. It connects with other UML diagrams to provide a full system view.
Relationship with Class Diagrams
Class Diagrams define the software structure. Deployment Diagrams define where that structure runs. An artifact in the Deployment Diagram often corresponds to a class or package in the Class Diagram.
Relationship with Component Diagrams
Component Diagrams show the software modules. Deployment Diagrams show the physical nodes. The Component Diagram refines the “Artifacts” found in the Deployment Diagram.
Relationship with Activity Diagrams
Activity Diagrams show the flow of actions. Deployment Diagrams provide the context for where these actions occur. For example, an activity “Process Payment” might occur on the “Payment Server” node.
🔍 Maintenance and Lifecycle
Architecture is not static. It evolves with requirements and technology.
Version Control
Just like code, diagrams should be versioned. Tag diagrams with versions that match the software release. This allows teams to compare old and new architectures during audits.
Automated Generation
In some workflows, deployment diagrams are generated from configuration files. While manual drawing offers flexibility, automated generation ensures the diagram matches the actual infrastructure state. However, this requires strict configuration management.
Review Cycles
Include diagram review in the design phase of the project. Before code is written, the deployment plan must be approved. This prevents costly rework later when hardware is provisioned incorrectly.
📊 Summary of Notation Elements
For quick reference, here is a summary of the most common elements used in this type of modeling.
| Element | Shape | Meaning |
|---|---|---|
| Node | Cube | Hardware or Execution Environment |
| Artifact | Document Icon | Software File or Data |
| Association | Solid Line | Physical Connection |
| Dependency | Dashed Line + Arrow | Logical Requirement |
| Boundary | Rectangle with Label | Security Zone or Grouping |
🚀 Practical Example Scenario
Consider a scenario where a company migrates from a monolith to a distributed system.
- Phase 1 (Monolith): Single server node hosting the application and database together.
- Phase 2 (Split): Application Server node and Database Server node separated by a network link.
- Phase 3 (Cloud): Load Balancer node directing traffic to multiple Application Server nodes across different regions.
Each phase would require a distinct Deployment Diagram. The transition between diagrams documents the architectural evolution.
🔐 Security Considerations
Security cannot be an afterthought. The diagram should reflect security controls.
- Firewalls: Drawn as nodes that filter traffic between zones.
- Encryption: Label lines with “SSL/TLS” to indicate secure communication.
- Authentication: Note where authentication tokens are validated (e.g., on the Load Balancer or the Application Server).
By visualizing security boundaries, architects can spot single points of failure or unsecured data paths.
📈 Scalability Implications
Deployment diagrams help plan for growth.
- Horizontal Scaling: Adding more nodes of the same type. The diagram shows multiple identical nodes connected to a load balancer.
- Vertical Scaling: Upgrading the hardware of a single node. The diagram might note the capacity limits of the node.
Understanding these options helps in capacity planning. The diagram serves as a map for future expansion.
🤝 Collaboration Benefits
Finally, these diagrams facilitate collaboration.
- Developers: Know where to deploy code.
- Operations: Know how to configure networks.
- Management: Understand infrastructure costs.
A shared visual language reduces miscommunication. It aligns the team on the physical reality of the software system.

