


System architecture relies heavily on clear documentation to ensure that software components align with the physical infrastructure. A UML Deployment Diagram serves as a critical artifact in this process, visualizing the hardware and software environments where applications reside. However, creating these diagrams is often more complex than simply drawing boxes and lines. Many architects fall into traps that obscure the true nature of the system, leading to deployment failures and confusion during maintenance.
This guide examines the specific errors frequently encountered when constructing UML Deployment Diagrams. By identifying these pitfalls and applying corrective strategies, you can produce diagrams that accurately reflect your infrastructure and facilitate smoother operations.
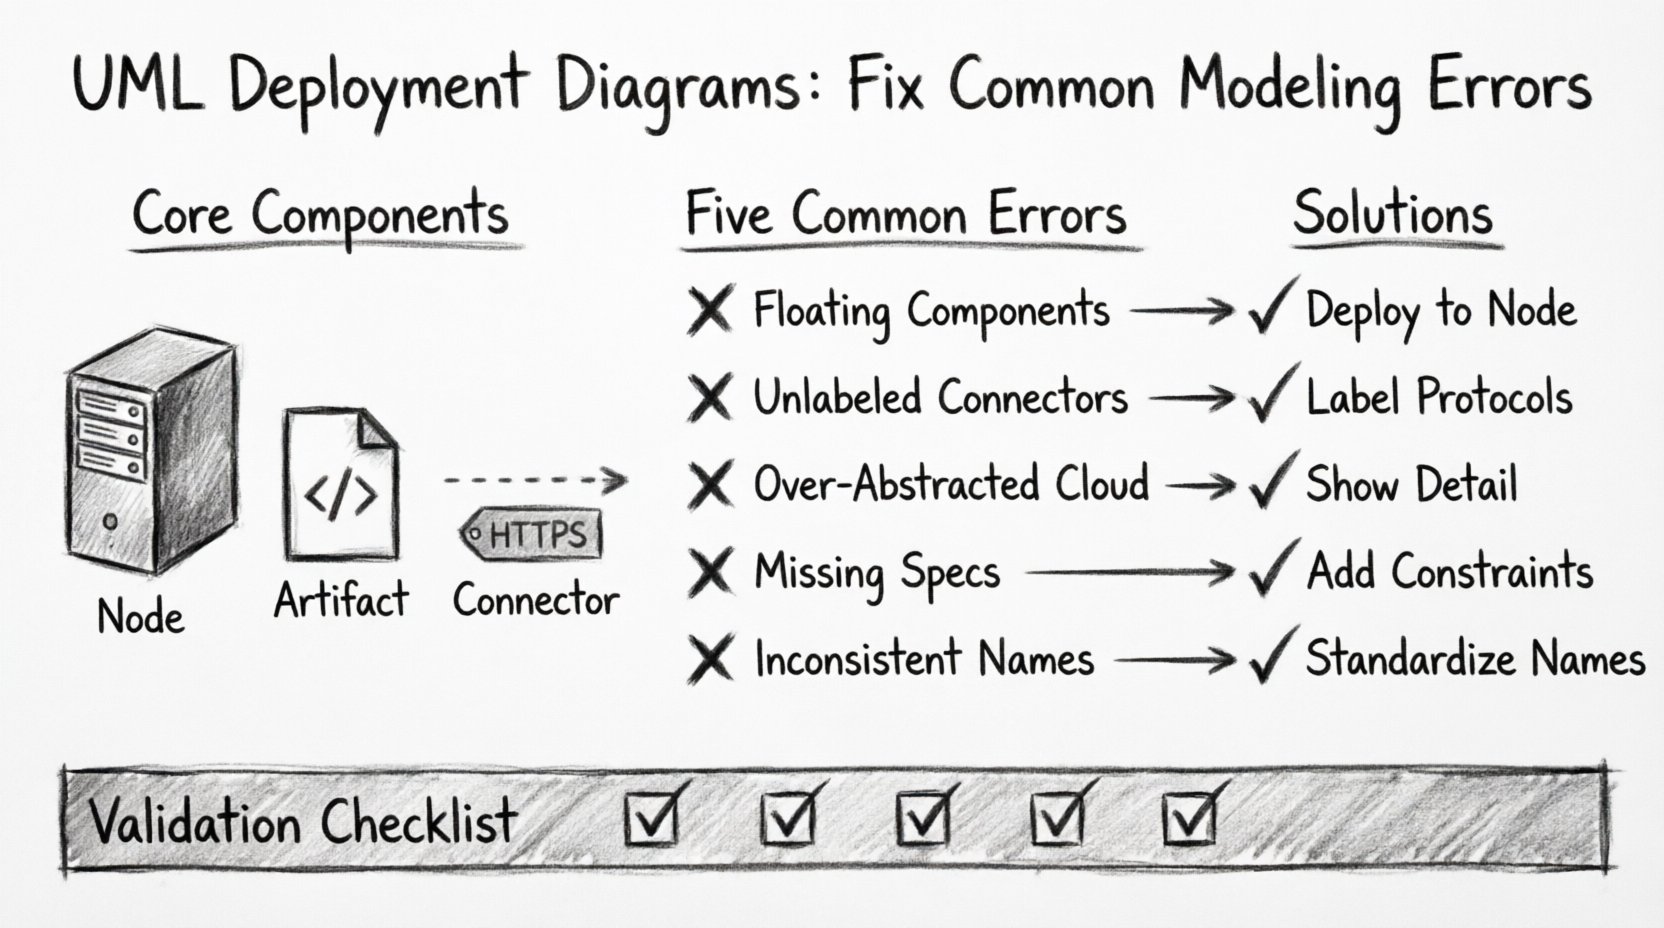
🧩 Understanding Core Components
Before addressing errors, it is essential to establish a baseline understanding of the elements involved. A deployment diagram consists of three primary constructs:
- Nodes: These represent physical or virtual computing resources. Examples include servers, routers, mobile devices, and cloud instances.
- Artifacts: These are physical representations of software components. Examples include executable files, libraries, database schemas, and configuration files.
- Connectors: These define the communication pathways between nodes and artifacts. They specify the protocols and media used for data transmission.
❌ Error 1: Confusing Nodes and Components
One of the most pervasive issues involves misidentifying the relationship between a node and a component. In many models, architects place components directly on the canvas without assigning them to a specific node. This creates ambiguity regarding where the software actually resides.
Why This Happens
- It is easier to draw components floating in space than to draw boxes for every server.
- There is a lack of clarity regarding the physical vs. logical deployment.
- The distinction between the container (node) and the content (component) is overlooked.
The Impact
When components are not explicitly deployed to nodes, operations teams cannot determine hardware requirements. This leads to issues during provisioning, where the wrong resources are allocated. It also complicates troubleshooting because the location of a failure is undefined.
The Fix
- Always associate artifacts and components with a specific node instance.
- Use dashed lines to indicate deployment relationships, pointing from the artifact to the node.
- Differentiate between the software definition (component) and the physical instance (artifact).
❌ Error 2: Ignoring Communication Protocols
Connectors in a deployment diagram are often drawn as generic lines without labels. While this keeps the diagram clean, it removes critical information about how systems interact. A line between a database node and an application node implies connectivity, but it does not specify the method.
Common Oversights
- Leaving connector labels blank.
- Failing to specify port numbers.
- Ignoring security protocols like SSL or SSH.
- Neglecting to distinguish between synchronous and asynchronous communication.
Why Protocols Matter
Network security and performance depend heavily on the protocols used. A diagram that does not specify whether communication is HTTP, TCP/IP, or a message queue can lead to security vulnerabilities. For instance, assuming unencrypted traffic where encryption is required can result in data breaches.
The Fix
- Label every connector with the protocol name.
- Include port numbers where applicable (e.g., 443 for HTTPS).
- Use distinct line styles for different types of traffic (e.g., solid for data, dotted for management).
- Specify if the connection is encrypted or authenticated.
❌ Error 3: Over-Abstracting the Topology
Sometimes, architects attempt to simplify diagrams too much. They might represent an entire data center as a single cloud icon. While this works for high-level executive summaries, it fails during technical implementation. Detailed deployment diagrams require a level of granularity that high-level abstractions lack.
When Abstraction Fails
- When defining load balancer configurations.
- When specifying redundancy and failover mechanisms.
- When planning network segmentation.
- When calculating resource requirements for specific services.
The Fix
- Identify the audience. Technical teams need node-level detail; stakeholders may need high-level views.
- Use nested diagrams. Keep the main diagram for high-level flow, and create detailed sub-diagrams for complex nodes.
- Explicitly show firewalls, gateways, and load balancers as distinct nodes.
- Document the number of instances for critical services (e.g., 3 Web Server nodes).
❌ Error 4: Neglecting Hardware and Software Constraints
A deployment diagram should not just show connectivity; it should show feasibility. Many models omit the constraints that dictate whether a system can actually run on the proposed hardware. This includes CPU, memory, storage, and operating system requirements.
Missing Constraints
- Operating System versions (e.g., Linux Ubuntu 22.04 vs. Windows Server 2019).
- Required runtime environments (e.g., Java JDK 17, .NET Core).
- Resource limits (e.g., 8 vCPU, 32GB RAM).
- Storage capacity requirements for databases.
The Consequence
Without these constraints, the deployment script may fail. The infrastructure team might provision a generic server that lacks the necessary OS or runtime libraries. This results in delays and rework during the deployment phase.
The Fix
- Add property stereotypes to nodes to define OS and hardware specs.
- Link artifacts to their specific version requirements.
- Document environment variables or configuration files needed at the node level.
- Include notes on dependency versions for all software artifacts.
❌ Error 5: Inconsistent Naming Conventions
Readability suffers when naming conventions are inconsistent. One node might be named “Web_Server_01”, while another is “Frontend_Node_A”. This inconsistency makes it difficult to search the diagram or correlate it with configuration management databases.
Common Naming Issues
- Mixing abbreviations and full words.
- Using environment names inconsistently (e.g., Dev, DEV, Development).
- Including unnecessary details in the node name (e.g., “Production-Web-Server-IP-192-168-1-10”).
- Lack of a prefix or suffix standard.
The Fix
- Establish a naming standard for the project.
- Use prefixes for environments (e.g., “prod-“, “dev-“).
- Use suffixes for roles (e.g., “-web”, “-db”, “-cache”).
- Avoid dynamic data (like IP addresses) in the static diagram name.
- Ensure all team members follow the same pattern.
📊 Validation Checklist for Deployment Diagrams
To ensure your diagram is accurate and useful, use the following table as a validation guide before finalizing the model.
| Check Item | Correct Approach | Common Mistake |
|---|---|---|
| Node Identification | Each node represents a physical or logical processing unit. | Nodes are mixed with components without clear boundaries. |
| Artifact Placement | Artifacts are deployed to specific nodes using dashed lines. | Artifacts float freely without deployment targets. |
| Connectivity | Connectors have labeled protocols and ports. | Lines are generic with no traffic specification. |
| Constraints | Hardware and software requirements are documented on nodes. | Resource requirements are omitted entirely. |
| Consistency | Naming follows a strict, project-wide convention. | Naming is random or inconsistent across the diagram. |
| Scalability | Multiple instances are shown for load balancing. | Single instances imply no redundancy. |
🔄 Iterative Refinement Process
Deployment diagrams are rarely perfect on the first attempt. They evolve as the architecture changes. An iterative refinement process helps maintain accuracy over time.
Step 1: Draft the Logical Topology
Start by defining the high-level flow of data. Identify the major zones (e.g., DMZ, Internal, External). Place the primary nodes in their respective zones.
Step 2: Add Physical Details
Refine the nodes to include specific hardware or cloud instance types. Add the operating systems and required runtimes.
Step 3: Define Interactions
Draw the connectors and label them with protocols. Ensure that all security boundaries are respected (e.g., firewalls between zones).
Step 4: Review Against Reality
Compare the diagram with the actual infrastructure or the deployment plan. Update any discrepancies. This step ensures the diagram remains a source of truth.
🛡️ Security Considerations in Modeling
Security is often an afterthought in diagramming, but it should be integrated into the design phase. A deployment diagram is a primary tool for security audits and penetration testing reviews.
Key Security Elements to Model
- Firewalls: Clearly mark the boundaries where traffic is filtered.
- Encryption: Indicate where data is encrypted at rest and in transit.
- Authentication Zones: Show where identity management systems are located.
- Network Segmentation: Separate critical databases from public-facing web servers.
Best Practices
- Do not expose internal IP addresses in public diagrams.
- Use generic names for sensitive nodes (e.g., “Auth_Service” instead of “Kerberos_Server”).
- Highlight the DMZ (Demilitarized Zone) clearly.
- Ensure that the diagram reflects the principle of least privilege.
📝 Handling Dynamic Environments
Modern infrastructure often relies on dynamic scaling, such as auto-scaling groups in cloud environments. A static deployment diagram cannot easily represent this fluidity. However, you can model the capacity to scale.
Modeling Scalability
- Indicate the minimum and maximum number of instances for a node.
- Show the load balancer distributing traffic across multiple nodes.
- Document the triggers for scaling (e.g., CPU usage thresholds).
- Use notes to explain the auto-scaling logic that is not visible in the static view.
🔍 Maintenance and Version Control
Once a diagram is complete, it must be maintained. Outdated diagrams are worse than no diagrams because they mislead the team. Treat the diagram as a living document that requires version control.
Maintenance Strategies
- Store diagrams in a central repository alongside the codebase.
- Update the diagram whenever infrastructure changes are deployed.
- Include a version number and last update date in the diagram footer.
- Assign ownership to a specific architect or team for maintenance.
🚀 Moving Forward with Accuracy
Avoiding common modeling errors requires discipline and a focus on precision. By strictly defining the relationship between nodes and artifacts, labeling communication paths, and documenting constraints, you create a blueprint that supports successful deployment. These diagrams serve as the bridge between design and reality. When that bridge is solid, the delivery of software becomes more predictable and reliable.
Focus on the details that matter: the hardware, the protocols, and the security boundaries. A well-constructed deployment diagram reduces ambiguity and empowers the entire team to understand the system architecture. Continue to refine your approach, and ensure that every box and line serves a clear purpose in the broader context of your infrastructure.
")
