


Software architecture requires a clear map of how digital solutions exist in the physical world. A UML deployment diagram serves this exact purpose. It visualizes the hardware infrastructure, software components, and the connections between them. This modeling technique bridges the gap between abstract logic and tangible execution environments. It allows stakeholders to see where code lives, how data flows across networks, and where potential bottlenecks may arise. Without this view, development teams often struggle to align their logical designs with physical constraints.
Understanding these diagrams is essential for system architects, DevOps engineers, and technical leads. They provide a snapshot of the deployment topology at a specific point in time. This guide explores the anatomy of these diagrams, the specific elements involved, and the relationships that bind them together. We will examine best practices for creating clear, maintainable models that communicate complex infrastructure needs effectively.
🏗️ Understanding the Core Purpose
A deployment diagram is a static structure diagram that describes the physical deployment of artifacts on hardware nodes. Unlike sequence diagrams that show behavior over time, or class diagrams that show static structure of code, deployment diagrams focus on the runtime environment. They answer critical questions:
- Where does the application execute?
- What hardware resources are required?
- How do different systems communicate?
- What are the security boundaries?
This visual representation is crucial during the transition from development to production. It ensures that the infrastructure team understands the load distribution, network requirements, and hardware specifications needed to support the software. It also helps in capacity planning and cost estimation by identifying the number of servers or devices needed to handle expected traffic.
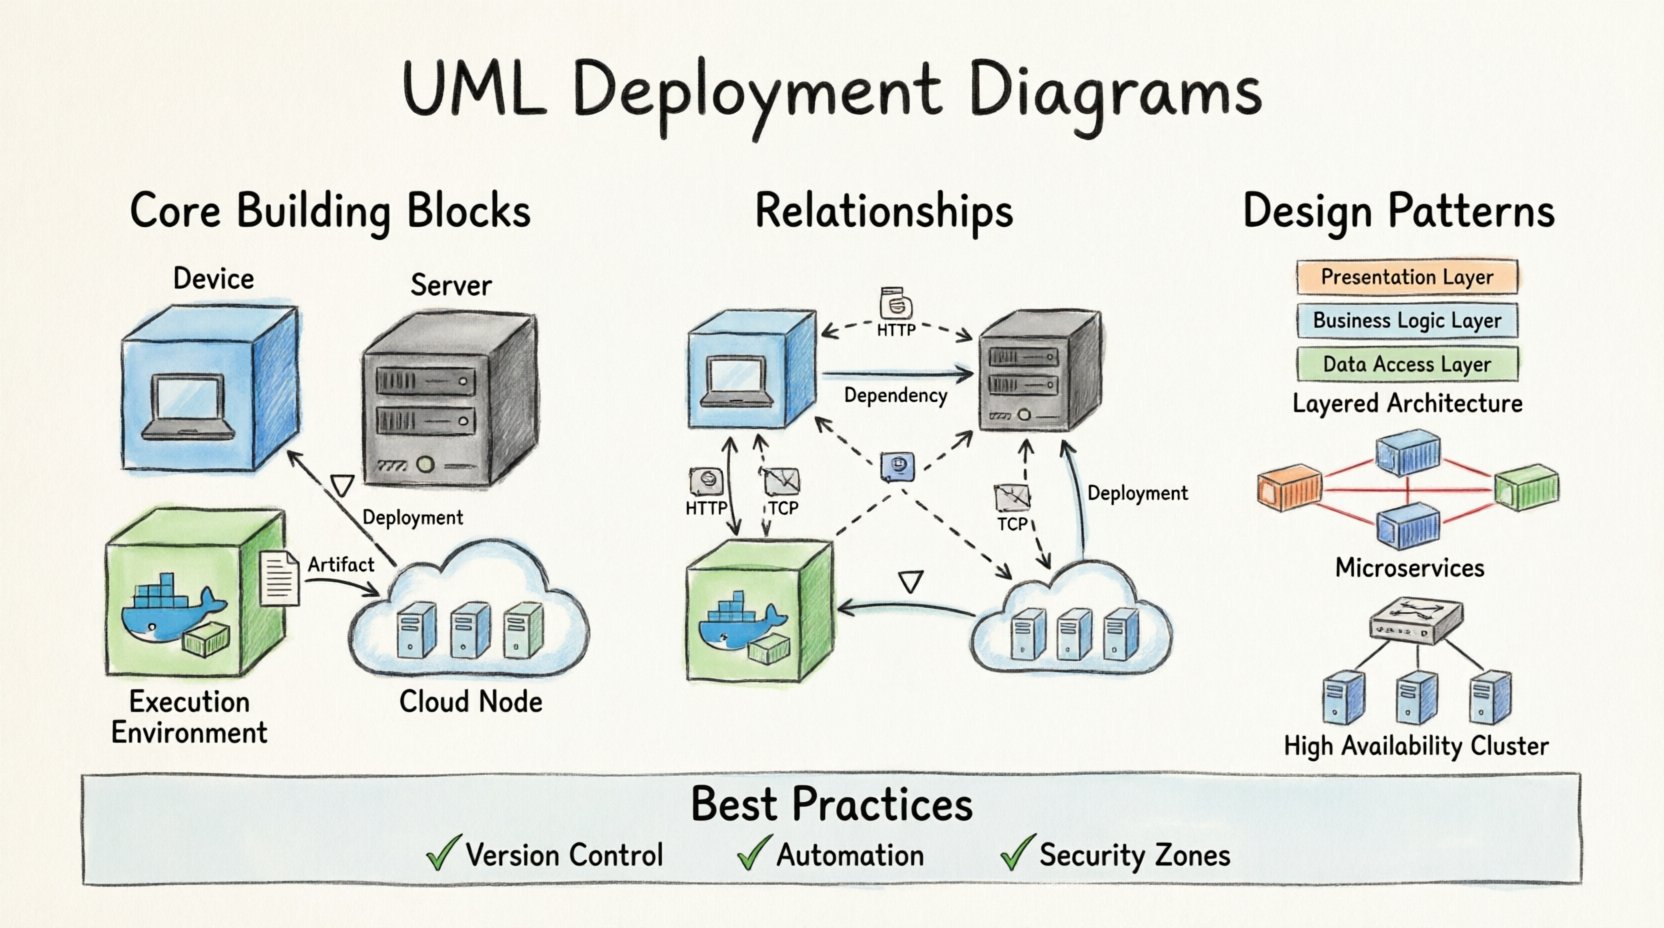
🧩 Core Building Blocks: Nodes and Artifacts
To construct an accurate model, one must understand the fundamental elements. The primary element is the Node. In UML, a node represents a computational resource. It is a physical or virtual device where software components are deployed. Nodes can range from simple embedded devices to complex servers or clusters.
Types of Nodes
Nodes are not generic. They define the type of execution environment. Choosing the correct notation for the node type helps stakeholders immediately understand the nature of the resource. Below is a breakdown of common node classifications.
| Node Type | Description | Typical Use Case |
|---|---|---|
| Device | A physical hardware resource with processing and storage capabilities. | End-user computers, routers, or IoT sensors. |
| Server | A node with a specific operating system and significant processing power. | Application servers, database servers, or web servers. |
| Execution Environment | A virtual environment that hosts components. | Containers, virtual machines, or runtime environments. |
| Cloud Node | A logical representation of a cloud-based resource. | Scalable groups of servers managed by a cloud provider. |
Artifacts and Components
Deployed onto these nodes are Artifacts. An artifact represents a physical piece of information that is used or produced by a software development process. This includes executable files, libraries, database schemas, configuration files, or documentation. It is the tangible output of the build process.
Components, on the other hand, represent modular parts of the software system. While components often reside within artifacts, the distinction is important. A component defines the software logic and interface, whereas the artifact is the file containing that logic. In a deployment diagram, components are often shown as nested inside artifacts or directly inside nodes.
Key characteristics of artifacts include:
- Versioning: Artifacts are versioned to ensure consistency across environments.
- Location: They are stored in repositories or on specific nodes.
- Dependencies: They rely on other artifacts to function correctly.
🔗 Relationships and Connectivity
Isolated nodes do not constitute a system. The value of a deployment diagram lies in the connections between elements. These relationships define how data and control signals move through the infrastructure. Properly defining these paths is vital for understanding latency, security, and fault tolerance.
Communication Paths
The most common relationship is the Communication Path. This represents a network connection between nodes. It indicates that components running on one node can communicate with components on another. These paths often imply specific protocols, such as HTTP, TCP/IP, or MQTT.
When modeling communication, consider the following:
- Directionality: Is the communication one-way or bidirectional?
- Protocol: Does the diagram imply encryption or specific headers?
- Bandwidth: Are there constraints on the speed of data transfer?
Other Critical Relationships
Beyond simple communication, other associations define the structure. An Association might indicate that a specific server manages a specific database. A Dependency shows that if one node fails, the other cannot function. A Uses relationship indicates that a component relies on a specific library or service provided by another node.
| Relationship Type | Symbolism | Meaning |
|---|---|---|
| Communication | Dashed line with open arrow | Nodes exchange messages or data. |
| Dependency | Dashed line with open arrow | One element relies on another for existence. |
| Association | Solid line | A structural link between two elements. |
| Deployment | Arrow pointing to node | An artifact is placed onto a node. |
🛠️ Strategic Design Patterns
Creating a deployment diagram is not just about placing boxes on a screen. It requires adherence to architectural patterns that ensure scalability and maintainability. Several patterns emerge frequently in modern system design.
Layered Architecture
In a layered approach, different tiers of the application are deployed on separate nodes or clusters. The presentation layer might reside on a web server, the business logic on an application server, and the data on a database server. This separation of concerns allows teams to scale specific layers independently. For instance, if user traffic spikes, only the presentation layer needs additional nodes.
Microservices Topology
Modern systems often utilize microservices. In this topology, a deployment diagram shows numerous small nodes or containers, each hosting a specific service. These services communicate over a network, often managed by an orchestrator. The diagram must clearly show the service discovery mechanism and the load balancers that distribute traffic across the instances.
High Availability Clusters
For critical systems, redundancy is non-negotiable. A deployment diagram should illustrate clustering. This involves grouping multiple nodes that perform the same function. If one node fails, another takes over. The diagram should show the load balancer distributing requests among the cluster members to ensure continuous operation.
🔄 Integrating with System Logic
A deployment diagram does not exist in isolation. It interacts with other models in the Unified Modeling Language. Understanding these connections ensures a coherent system design.
- Component Diagrams: These define the internal structure of the software. The deployment diagram shows where these components are placed. The component diagram details the interfaces, while the deployment diagram details the physical hosting.
- Sequence Diagrams: These show the flow of messages. The deployment diagram validates whether the physical nodes can support the message flow shown in the sequence diagram.
- Class Diagrams: While class diagrams show data structures, deployment diagrams show the memory and processing environment where those structures reside.
When creating these models, consistency is key. If a component is shown in the component diagram, it must appear in the deployment diagram if it is deployed. If a node is added in the deployment diagram, the connectivity must be reflected in the sequence diagrams.
🚫 Common Implementation Errors
Even experienced architects can make mistakes when modeling infrastructure. These errors can lead to miscommunication between teams or deployment failures. Being aware of common pitfalls helps in creating more robust diagrams.
Over-complication
A diagram that tries to show every single cable or switch is difficult to read. Focus on the logical topology rather than the physical cabling. Use aggregation to group multiple servers into a single logical node if they perform the same function. This keeps the diagram high-level and understandable.
Ignoring Latency
Placing a database server on the same node as the application server might save network hops, but it can create resource contention. Conversely, placing them too far apart can introduce latency. The diagram should reflect the network topology that supports the performance requirements. Labeling communication paths with estimated latency or bandwidth can add valuable context.
Mislabeling Artifacts
Confusing an artifact with a component is a frequent error. Remember, the artifact is the file, and the component is the software unit. While they are often co-located, distinguishing them helps in understanding the build and deployment process. An artifact is what gets copied; a component is what gets executed.
Neglecting Security Zones
Network security is critical. A deployment diagram should explicitly show firewalls, DMZs, and internal networks. Components handling sensitive data should be placed in secure nodes, separated from public-facing servers. Failing to depict these boundaries can lead to security vulnerabilities during implementation.
📈 Maintenance and Evolution
Infrastructure is not static. Systems evolve, and deployment diagrams must evolve with them. A static diagram becomes obsolete quickly if the system changes. Regular reviews of the diagram are necessary to ensure it matches the current state of the production environment.
Consider these strategies for maintaining the model:
- Version Control: Treat the diagram like code. Store it in a repository and track changes over time.
- Automation: Whenever possible, generate diagrams from the infrastructure as code definitions. This ensures the visual model matches the actual configuration.
- Documentation Links: Link the diagram to relevant documentation regarding configuration, scaling policies, and disaster recovery plans.
By treating the deployment diagram as a living document, teams can maintain a clear understanding of their architecture. This clarity reduces the risk of errors during updates and helps new team members understand the system quickly.
🌐 Conclusion on System Topology
Mastering the creation of UML deployment diagrams is a fundamental skill for anyone involved in software infrastructure. It transforms abstract requirements into a tangible plan for execution. By carefully selecting nodes, defining artifacts, and mapping relationships, architects can create a blueprint that guides the deployment process effectively.
The diagram serves as a communication tool for diverse teams. Developers understand where to deploy code. Operations teams understand what hardware to provision. Security teams understand where to place firewalls. When these models are accurate and clear, the path from development to production becomes smoother and more reliable. Focus on clarity, adhere to standards, and remember that the goal is to model reality, not just theory.

