


Introduction
In the realm of data visualization, clarity and efficiency are paramount. Visual Paradigm continuously evolves to meet the needs of developers, data analysts, and designers by making the visual creation experience smoother, faster, and more intuitive. With the latest enhancement to VPasCode, users can now leverage native Apache ECharts support combined with a powerful new auto-formatting feature. This comprehensive guide will walk you through how to visualize ECharts using VPasCode and utilize the one-click auto-formatting tool to keep your code clean, readable, and effortlessly editable.
Step-by-Step Guide: How to Visualize and Auto-Format ECharts in VPasCode
Step 1: Access the VPasCode Editor
Navigate to the VPasCode platform, Visual Paradigm’s unified Diagram-as-Code (DaC) playground. This interactive, browser-based editor is designed to handle various code-driven visualizations, including the newly integrated Apache ECharts environment.
Step 2: Input Your ECharts Configuration
In the left-hand panel of the side-by-side interface, paste or type your ECharts configuration object. Whether you are building a stacked bar chart, a radar chart, or a complex dashboard component, VPasCode accepts standard ECharts option structures seamlessly.
Step 3: Visualize in Real-Time
As you input your code, the right-hand panel instantly renders the interactive chart. This real-time feedback loop allows you to see the direct impact of your configuration changes without needing to refresh the page or manually compile the script.
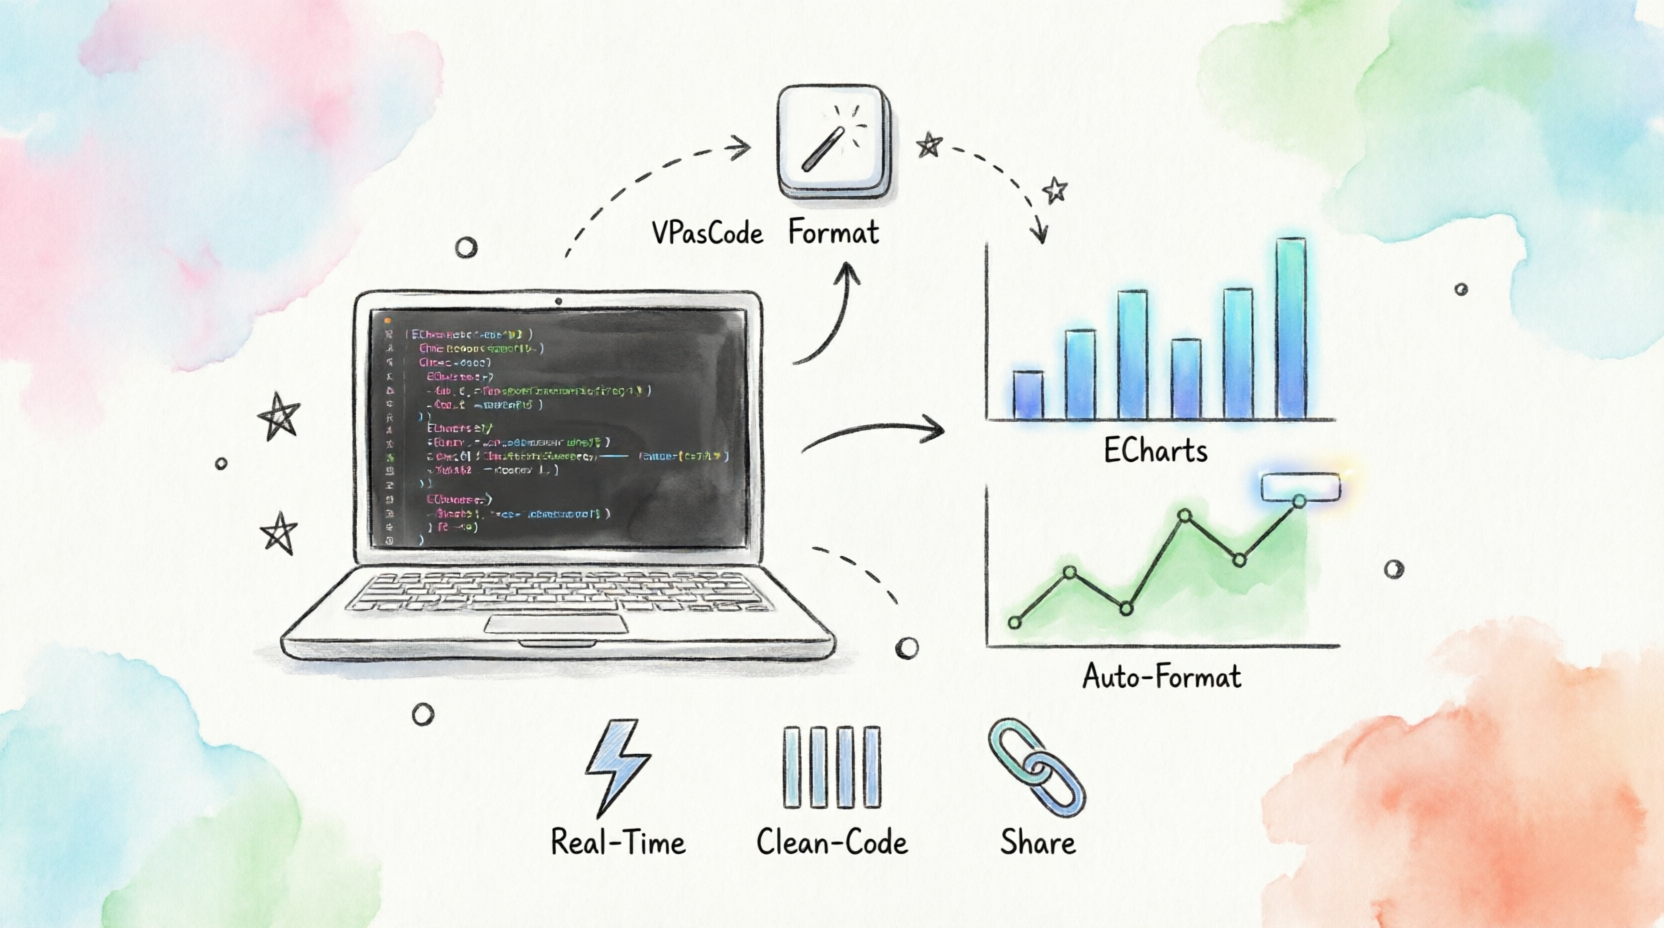
Figure 1: The VPasCode interface allows for seamless code editing and real-time visualization rendering.
Step 4: Apply One-Click Auto-Formatting
Working with complex chart scripts often leads to squeezed, multi-line attributes that are prone to editing mistakes and missed details. To resolve this, simply click the </> Format button located at the top of the editor. This instantly transforms your code structure by applying clean, standard indentations.
Step 5: Edit with Effortless Clarity
Once formatted, every attribute is clearly listed on its own line. This “nothing hidden” approach gives you total visibility over your chart’s structure, allowing you to quickly locate and update labels, series data, or styling rules without hunting through packed lines of code.
Step 6: Share or Export Your Work
VPasCode automatically compresses every diagram configuration into a unique, shareable URL. You can easily collaborate on code reviews, embed the chart in wiki documentation, or present it live to clients with a single, frictionless link.
Practical ECharts Example: Sales Performance Dashboard
To demonstrate the power of VPasCode’s ECharts integration, let’s walk through a complete example of a sales performance dashboard.
Before Formatting (Compressed Code):
{title:{text:'Monthly Sales Performance'},tooltip:{trigger:'axis'},legend:{data:['Product A','Product B','Product C']},xAxis:{type:'category',data:['Jan','Feb','Mar','Apr','May','Jun']},yAxis:{type:'value'},series:[{name:'Product A',type:'bar',data:[120,200,150,80,70,110]},{name:'Product B',type:'bar',data:[220,182,191,234,290,330]},{name:'Product C',type:'line',data:[150,230,224,218,135,147]}]}
After Auto-Formatting (Clean, Readable Code):
{
  title: {
    text: 'Monthly Sales Performance'
  },
  tooltip: {
    trigger: 'axis'
  },
  legend: {
    data: ['Product A', 'Product B', 'Product C']
  },
  xAxis: {
    type: 'category',
    data: ['Jan', 'Feb', 'Mar', 'Apr', 'May', 'Jun']
  },
  yAxis: {
    type: 'value'
  },
  series: [
    {
      name: 'Product A',
      type: 'bar',
      data: [120, 200, 150, 80, 70, 110]
    },
    {
      name: 'Product B',
      type: 'bar',
      data: [220, 182, 191, 234, 290, 330]
    },
    {
      name: 'Product C',
      type: 'line',
      data: [150, 230, 224, 218, 135, 147]
    }
  ]
}
What This Example Demonstrates:
-
Mixed Chart Types: Combines bar charts for Products A and B with a line chart for Product C, showcasing ECharts’ flexibility
-
Interactive Features: Includes tooltip triggers and legend controls for enhanced user interaction
-
Clear Data Structure: The auto-formatted version makes it immediately obvious where each series begins and ends
-
Easy Modifications: Need to add a fourth product? With formatted code, you can simply copy a series block and modify the values
-
Professional Presentation: The title, axes, and data are all properly configured for a production-ready dashboard
Try This Yourself:
-
Copy the “Before Formatting” code above
-
Paste it into VPasCode’s left panel
-
Click the
</> Formatbutton to see the transformation -
Watch as the chart renders instantly on the right
-
Experiment by changing values, adding new series, or modifying colors
Conclusion
The integration of ECharts auto-formatting in VPasCode represents a significant leap forward for technical teams seeking to streamline their data visualization workflows. By eliminating the friction of cluttered code, Visual Paradigm empowers users to design professional, interactive charts with unprecedented ease. Whether you are generating AI-driven dashboards or fine-tuning manual configurations, VPasCode ensures your code remains as elegant and structured as the visualizations it produces. Launch the live editor today and experience the difference that clean, formatted code can make.
Reference
-
Enhance Your Workflow: ECharts Auto-Formatting Now Live in VPasCode: Introduces the new one-click code formatting feature for ECharts scripts in VPasCode.
-
Best Chart Editor & Unified Diagram-as-Code Platform: Announces native Apache ECharts support for building interactive data visualizations directly in VPasCode.
-
VPasCode: Unified Diagram-as-Code Platform: Overview of VPasCode as a smart, AI-assisted diagram-as-code playground and editor.
-
Visualize XML Instantly with VPasCode: Details the XML visualization and auto-formatting capabilities within the VPasCode environment.
