Introduction
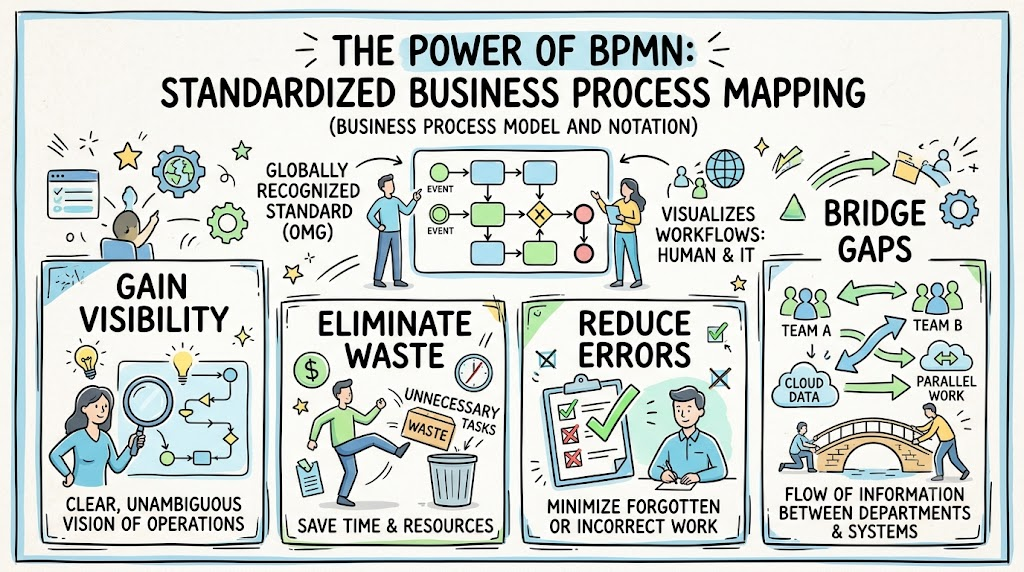
In the modern business landscape, clarity is currency. Whether you are a startup founder trying to streamline operations or an enterprise manager looking to optimize cross-departmental workflows, understanding exactly how work gets done is critical. Enter Business Process Model and Notation (BPMN).
Often described as “a flowchart on steroids,” BPMN is the globally recognized standard for graphically mapping business processes. Since its inception in 2004 under the Object Management Group (OMG), it has evolved into the definitive language for visualizing both human-centric and IT-driven workflows.
Why does this matter? When you map your processes using a standardized method like BPMN, you gain the ability to:
-
Gain Visibility: Get a clear, unambiguous vision of how every part of your business operates.
-
Eliminate Waste: Identify and remove unnecessary tasks, saving time and resources.
-
Reduce Errors: Minimize the rate at which employees forget, overlook, or incorrectly execute work.
-
Bridge Gaps: Clearly represent information flow between teams, cloud data storage, and parallel departmental work.
This guide serves as a comprehensive standalone resource for startups and small businesses looking to transfer rough notes and sketches into professional, actionable process maps.
Part 1: The Canvas – Pools and Lanes
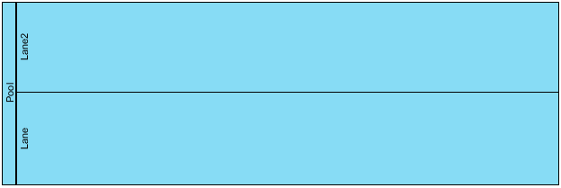
Before drawing specific tasks, you must understand the structure of the BPMN canvas. The hierarchy is built on Pools and Lanes.
1. Pools
A Pool represents a major participant in the process. It is the largest container on the map.
-
Definition: Pools typically represent different organizations (e.g., your company vs. a customer) or entirely separate entities.
-
Rule: Each pool can contain a maximum of one distinct process.
-
Usage Example: In a customer support scenario, you might have one pool labeled “Process Street” (your company) and another labeled “Customer.” Work flows between these pools via message exchanges.
2. Lanes
Lanes subdivide a Pool. They represent different roles, departments, or systems within the same organization.
-
Definition: Lanes show who is responsible for specific tasks and how different internal units interact.
-
Flexibility: Lanes do not strictly have to be departments. According to standards like Camunda, lanes can represent:
-
Positions: e.g., Accounting Clerk.
-
Roles: e.g., Data Protection Officer.
-
General Roles: e.g., Customer.
-
Departments: e.g., Sales, HR.
-
IT Applications: e.g., CRM System, ERP.
-
Example: Order Fulfillment
Imagine a simple order process. Instead of a chaotic list of steps, BPMN organizes them into lanes:
-
Lane: Sales Dept: Receives phone order, charges credit card, notes SKU.
-
Lane: Warehouse: Receives email with SKU, packages item, prints label.
-
Lane: Shipping: Mails item to customer.
This visual separation clarifies hand-offs and responsibilities instantly.
Part 2: Basic Notation – Activities and Connecting Objects
Once the canvas is set, you populate it with elements that describe the work.
1. Activities (Tasks)
-
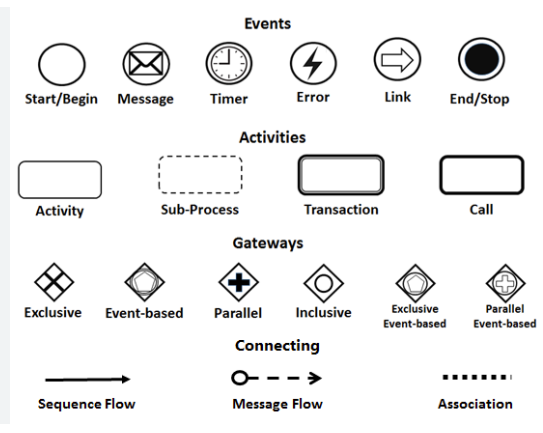
Symbol: A rectangle with rounded corners.
-
Meaning: Represents a unit of work to be done. Think of it as a checkbox on a checklist or an item on a to-do list.
-
Example: “Review Invoice,” “Send Welcome Email,” “Update Database.”
2. Connecting Objects
BPMN uses three specific types of lines to show relationships. Using the wrong line makes the map invalid or misleading.
| Type | Symbol | Usage | Key Rule |
|---|---|---|---|
| Sequence Flow | Solid Line with Arrow | Shows the order of activities within the same pool/lane. | Mandatory. Without sequence flows, activities are disconnected. |
| Message Flow | Dashed Line with Open Arrow | Shows communication between two different pools (or sometimes lanes). | Represents requests or information sharing, not direct control. Used when one party doesn’t oversee the other’s work. |
| Association | Dotted Line | Links artifacts (documents, data objects) to activities. | Used to show that a task requires or produces a document (e.g., linking a “Purchase Order” PDF to a “Sign Off” task). |
Part 3: Logic and Control – Gateways
Processes rarely move in a straight line. Decisions, waits, and parallel actions require Gateways. Gateways are represented by diamond shapes and control the branching and merging of flows.
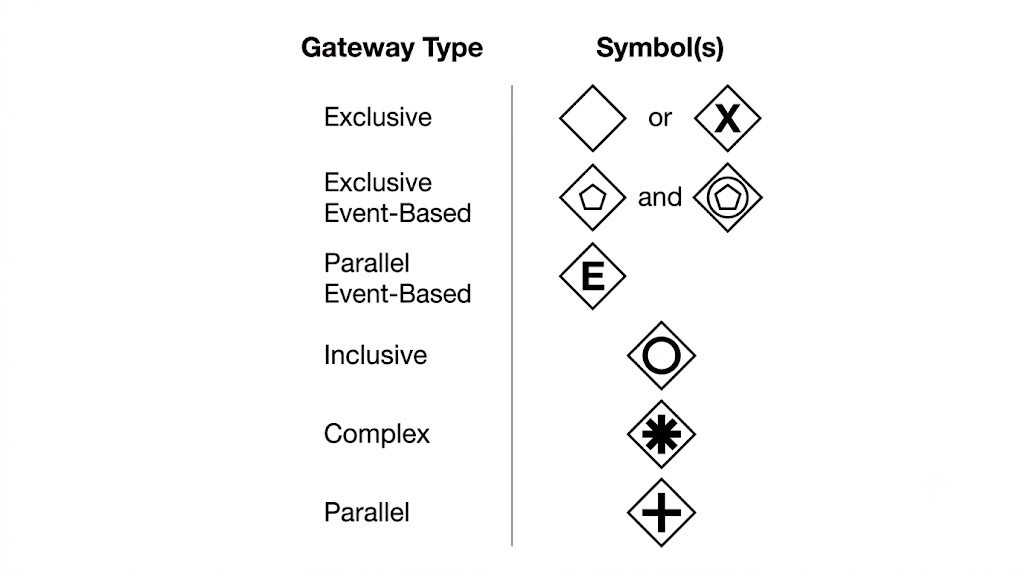
1. Exclusive Gateway (XOR)
-
Symbol: Diamond with an “X” inside (or empty diamond in some tools).
-
Logic: “Either/Or.” The process can go down only one path based on a condition.
-
Example: A podcast submission is reviewed.
-
Path A: Accepted → Moves to Editing.
-
Path B: Rejected → Sent back to Editor.
-
Note: It cannot be both accepted and rejected simultaneously.
-
2. Parallel Gateway (AND)
-
Symbol: Diamond with a “+” inside.
-
Logic: “Both/And.” The process splits into multiple branches that happen simultaneously. All branches must complete before the process merges back together.
-
Example: Onboarding a new employee.
-
Branch 1: IT sets up laptop.
-
Branch 2: HR prepares contract.
-
Branch 3: Manager prepares workspace.
-
Merge: Once all three are done, the employee starts day one.
-
3. Inclusive Gateway (OR)
-
Symbol: Diamond with a circle “O” inside.
-
Logic: “One or More.” The process splits into multiple branches, but unlike parallel gateways, not all branches need to be taken. One, several, or all paths may be triggered based on conditions.
-
Example: Customer Survey Response.
-
Condition A: Satisfied with Product A → Send Voucher.
-
Condition B: Satisfied with Product B → Add to “B” List.
-
Condition C: Not Satisfied → Trigger Support Ticket.
-
Outcome: A customer could be satisfied with A and B, triggering both the voucher and the list addition.
-
4. Event-Based Gateway
-
Symbol: Double-lined diamond with circles inside representing events.
-
Logic: “Wait and See.” The process pauses and waits for a specific event to occur. The path taken depends on which event happens first.
-
Example: Waiting for a delivery.
-
You reach a decision point after one week.
-
Event A: Package arrives → Process ends happily.
-
Event B: No package → Call shipping company.
-
Note: The gateway branches based on whether a Time event passes or a Message (package arrival) is received.
-
Part 4: Events and Artifacts
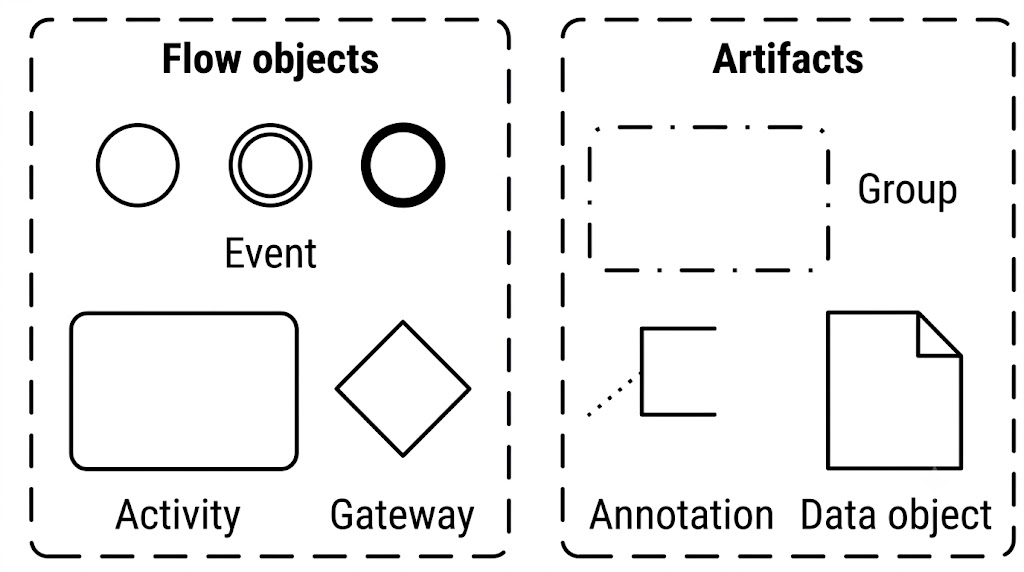
While activities are the “work,” events are the “triggers” or “results,” and artifacts are the “data.”
Common Events
-
Start Event: A thin-bordered circle. Indicates where the process begins (e.g., “Customer places order”).
-
End Event: A thick-bordered circle. Indicates where the process finishes (e.g., “Ticket Closed”).
-
Intermediate Events: Circles placed on the flow line.
-
Timer Event: Clock icon. Represents a delay or deadline (e.g., “Wait 2 days”).
-
Message Event: Envelope icon. Represents sending or receiving information (e.g., “Email sent to warehouse”).
-
Artifacts
-
Data Objects: Document icons linked via Association lines. They clarify what information is needed or produced by a task.
Part 5: Comprehensive Example – Customer Support Ticket
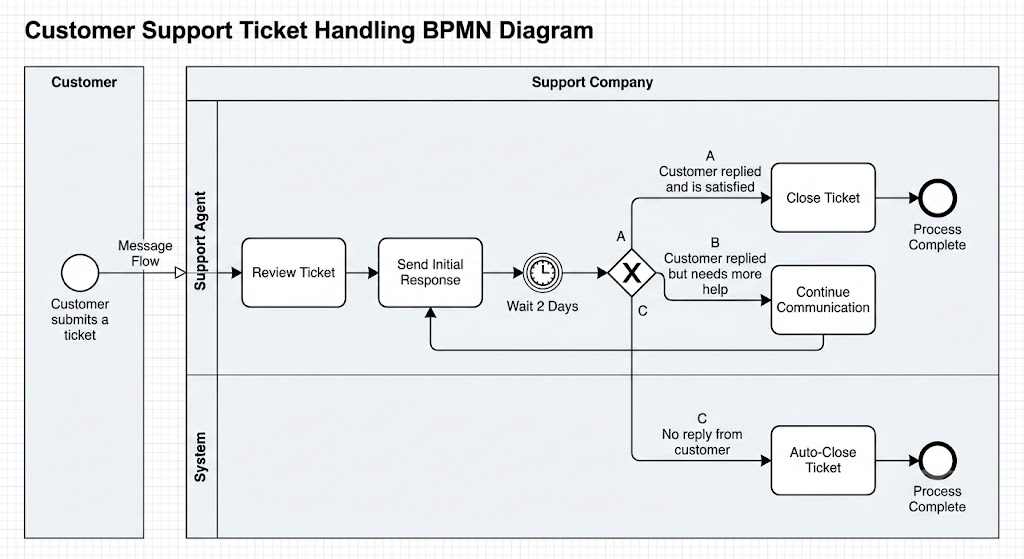
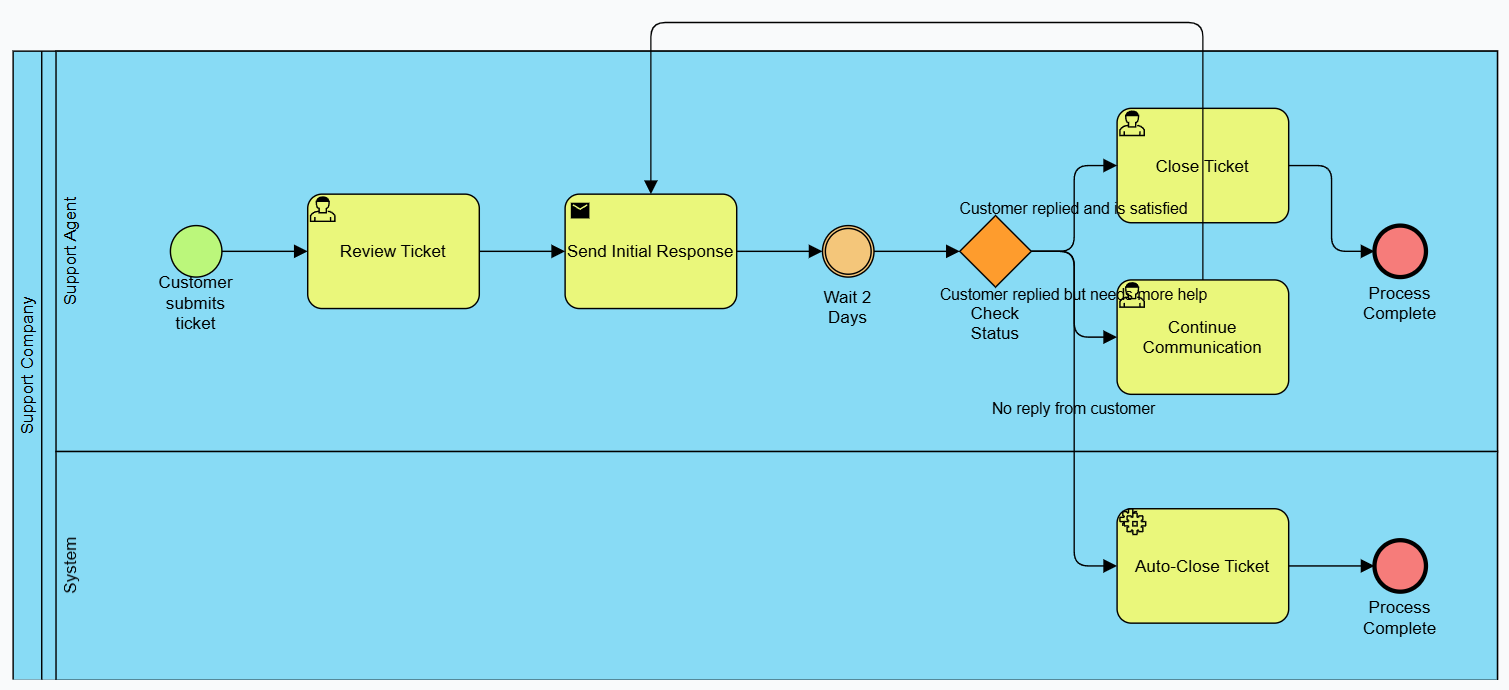
Let’s combine all concepts into a realistic scenario: Handling a Customer Support Ticket.
The Setup:
-
Pool 1: Customer
-
Pool 2: Support Company (with Lanes: Support Agent and System)
The Flow:
-
Start Event: Customer submits a ticket (Message Flow from Customer Pool to Support Pool).
-
Activity (Support Agent): “Review Ticket.”
-
Activity (Support Agent): “Send Initial Response.”
-
Intermediate Timer Event: “Wait 2 Days.”
-
Exclusive Gateway: Check status.
-
Path A (Condition Met): Customer replied and is satisfied.
-
Activity: “Close Ticket.”
-
End Event: Process Complete.
-
-
Path B (Condition Met): Customer replied but needs more help.
-
Activity: “Continue Communication.”
-
Loop back to Step 3.
-
-
Path C (Condition Met): No reply from customer.
-
Activity: “Auto-Close Ticket.”
-
End Event: Process Complete.
-
-
This map clearly shows the interaction between the customer and the agent, the automated waiting period, and the logical decisions made by the support team.
Tooling: Visual Paradigm AI import BPMN and Auto-layout
Copy and paste the same description into the Visual Paradigm AI Chatbot:
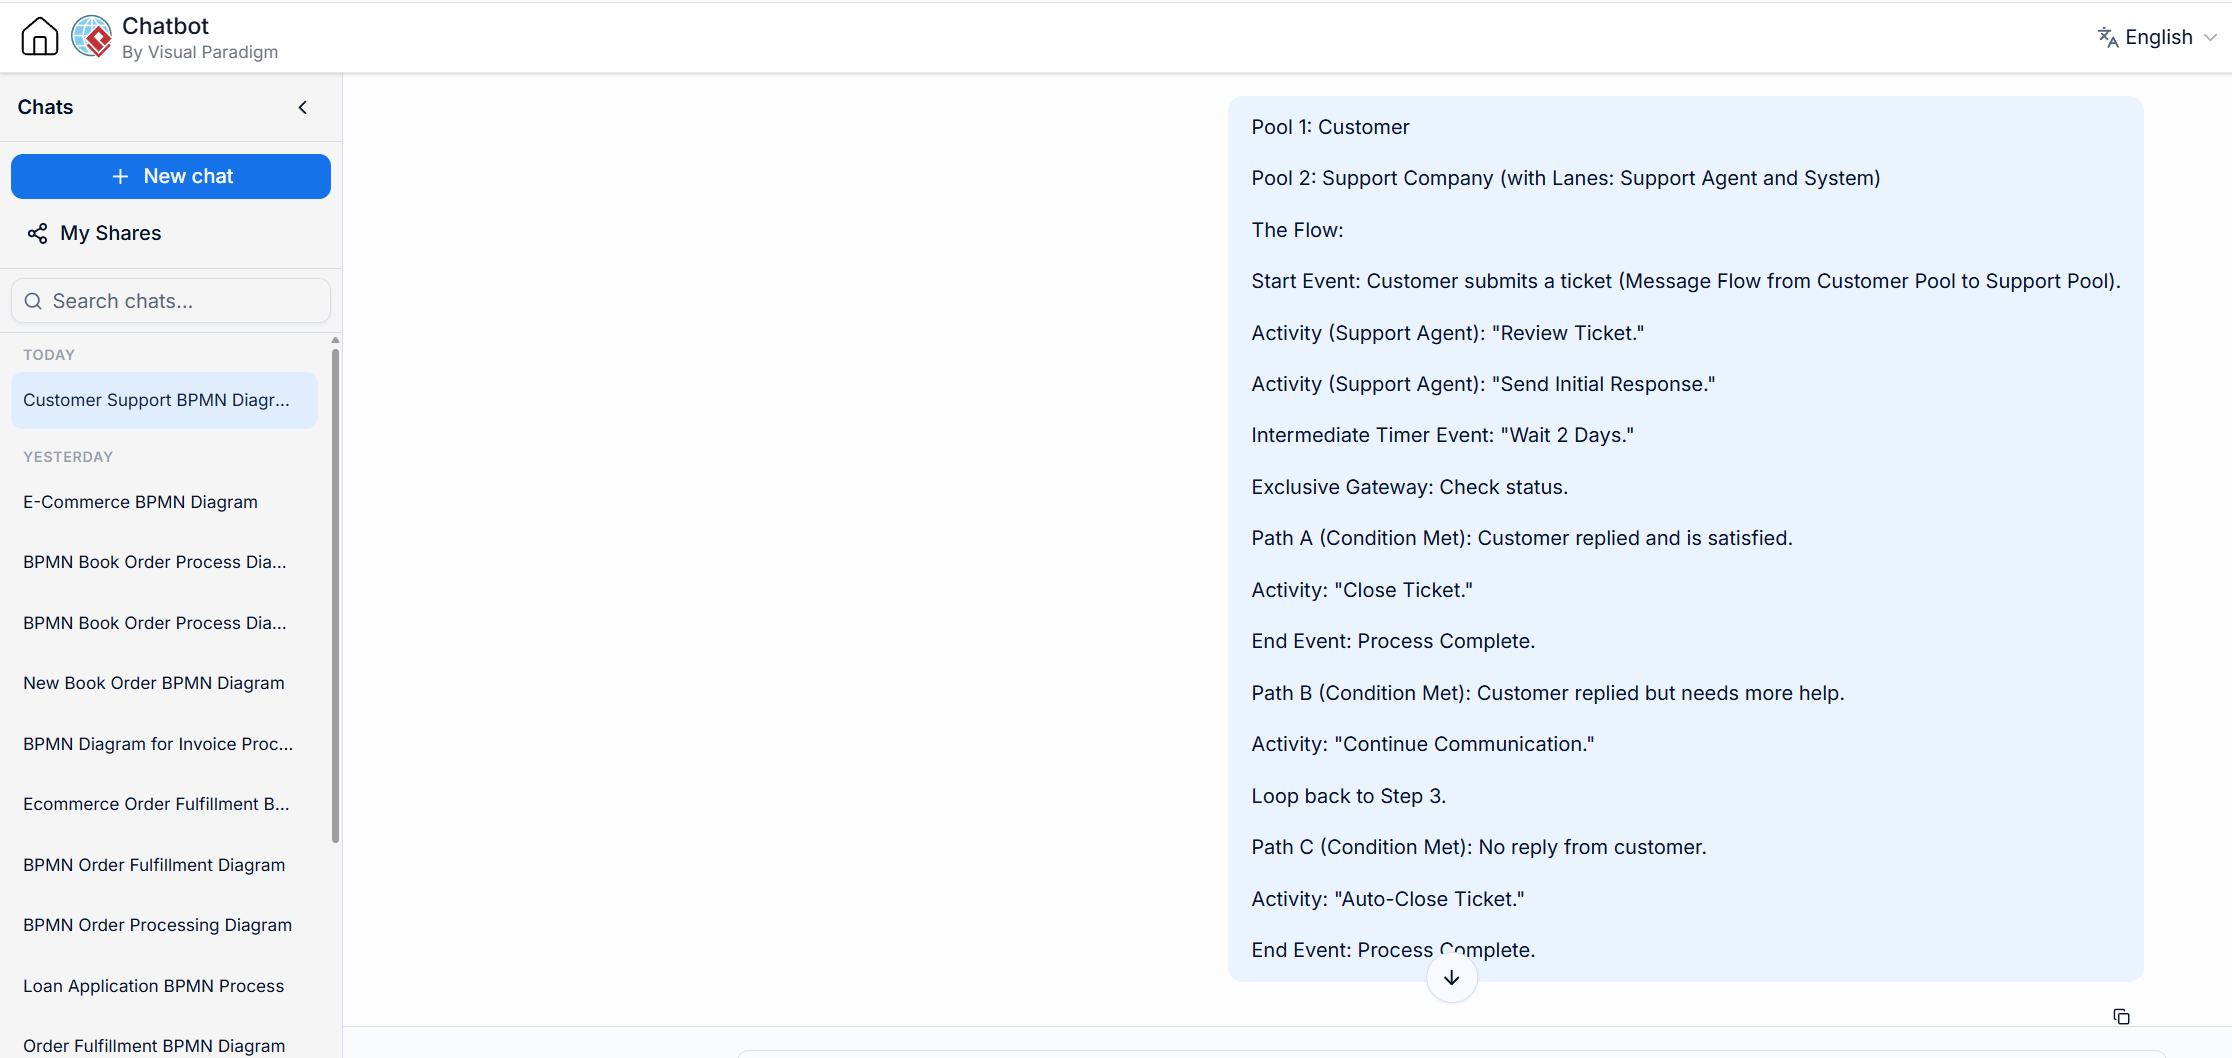
Visual Paradigm AI Chatbot BPMN Generation and Auto-layout:
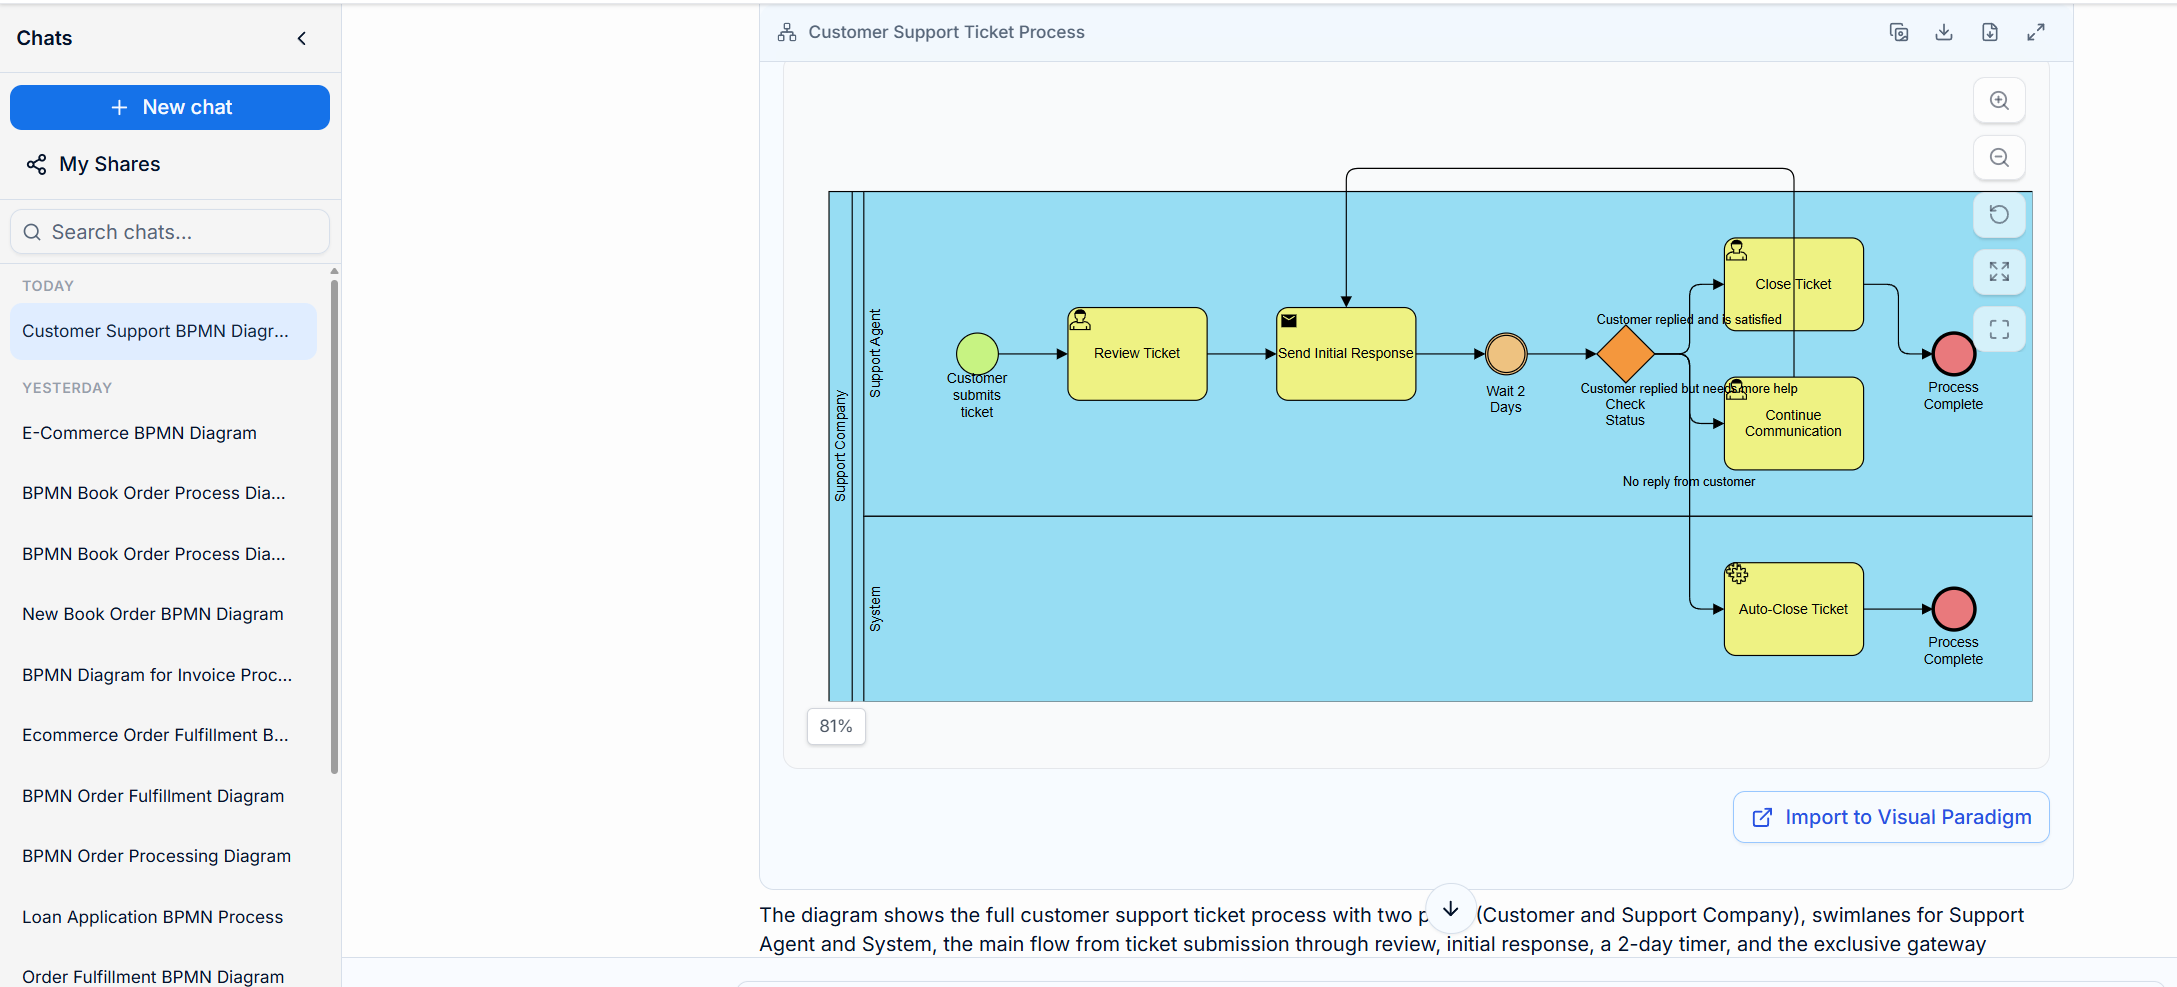
BPMN Example 2: Online Order & Delivery Process
Here is a textual description for a process model: Processing an Online Order & Delivery.
Process Overview: Online Order & Delivery
Setup
-
Pool 1: Customer
-
Pool 2: E-Commerce Company
-
Lane 1: Order Fulfillment
-
Lane 2: Logistics System
-
Process Flow
-
Start Event: Customer places an order on the website (Message Flow from Customer Pool to Order Fulfillment Lane).
-
Activity (Order Fulfillment): “Verify Payment & Inventory.”
-
Exclusive Gateway: Is the item in stock and payment approved?
-
Path A (No – Payment Failed / Out of Stock):
-
Activity (Order Fulfillment): “Send Cancellation Email.”
-
End Event: Order Cancelled.
-
-
Path B (Yes – Approved):
-
Proceed to step 4.
-
-
-
Activity (Order Fulfillment): “Pack Order.”
-
Activity (Logistics System): “Generate Shipping Label & Assign Courier.”
-
Intermediate Timer Event: “Wait for Courier Pickup (Max 24 Hours).”
-
Exclusive Gateway: Courier status update.
-
Path A (Picked Up On Time):
-
Activity (Logistics System): “Send Tracking Details to Customer.”
-
Activity (Logistics System): “Mark Order as Shipped.”
-
End Event: Order Complete.
-
-
Path B (Pickup Delayed):
-
Activity (Logistics System): “Flag Order for Support Escalation.”
-
End Event: Escalation Triggered.
-
-
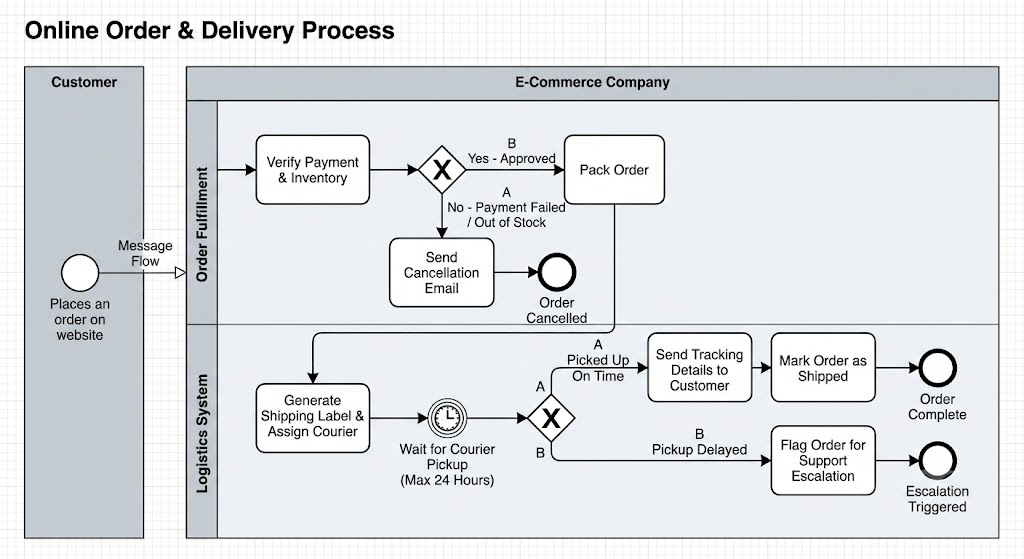
AI Assisted BPMN Generation – Visual Paradigm AI Chatbot
Conclusion
BPMN is more than just drawing boxes and arrows; it is a precise language for business logic. By mastering Pools and Lanes, you define responsibility. By using the correct Connecting Objects, you clarify communication versus control. And by leveraging Gateways, you model the complex reality of decision-making and parallel work.
While this guide covers the essential 80% of use cases for most businesses, the depth of BPMN allows for infinite customization as your organization grows. The key to mastery is practice: start mapping your current processes, identify bottlenecks, and refine your diagrams as you learn.
Recommended Tooling
To create professional BPMN diagrams, you need robust software that enforces these standards while remaining user-friendly. We recommend Visual Paradigm. It offers a comprehensive suite of BPMN tools that allow you to drag-and-drop standardized symbols, validate your diagrams against BPMN 2.0 rules, and collaborate with team members in real-time. Whether you are documenting a simple onboarding checklist or a complex multi-departmental workflow, Visual Paradigm provides the precision and flexibility needed to turn your process maps into actionable business assets.
Start small, think logically, and let BPMN bring clarity to your chaos.