
AI-Enhanced SWOT Analysis: Architecting Starbucks’ Strategic Matrix
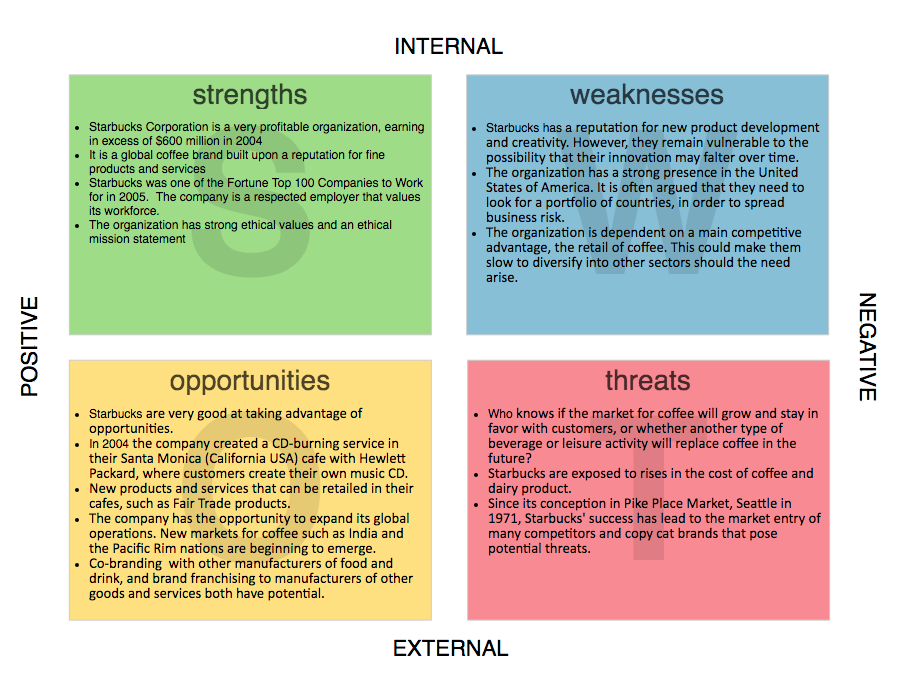
In the realm of business intelligence and system architecture, strategic planning is often visualized through specific analytical frameworks. The image provided presents a classic SWOT Analysis for Starbucks. While this is a business tool, from a technical modeling perspective, it represents a fundamental 2×2 Quadrant Matrix used to classify data based on two distinct binary dimensions: Internal/External and Positive/Negative.
This tutorial explores how to conceptualize, structure, and implement this specific type of strategic diagram using the logic found in tools like Visual Paradigm.
Understanding the Structural Logic
The SWOT matrix is not merely a list of points; it is a logical classification system. To model this effectively in a diagramming tool, one must understand the coordinate system defined by the axes.
The Matrix Axes
The diagram is divided by two primary orthogonal axes:
- Vertical Axis (Internal vs. External): This axis determines the locus of control.
- Internal (Top): Factors that exist within the organization’s boundaries (Strengths, Weaknesses).
- External (Bottom): Factors existing in the broader market environment (Opportunities, Threats).
- Horizontal Axis (Positive vs. Negative): This axis determines the impact on the organization’s goals.
- Positive (Left): Factors that aid the organization (Strengths, Opportunities).
- Negative (Right): Factors that hinder the organization (Weaknesses, Threats).
Technical Implementation in Modeling Tools
When implementing this in software like Visual Paradigm, the goal is to represent the data as a structured grid rather than a simple unorganized text block. This allows for potential logic linking—for example, connecting a specific “Strength” to an “Opportunity” to form a strategic SO (Strength-Opportunity) strategy.
To build this diagram technically, we define the layout using a grid system. Below is the pseudo-code logic for defining the SWOT matrix structure.
@startuml
skinparam backgroundColor white
skinparam shadowing false

' Define the 2x2 Grid Layout
left to right direction

' The Header (Internal/External)
rectangle "INTERNAL" as TopHeader {
  rectangle "Strengths" as S {
    note as S1
    note as S2
  }
  rectangle "Weaknesses" as W {
    note as W1
    note as W2
  }
}

' The Footer (Internal/External)
rectangle "EXTERNAL" as BottomFooter {
  rectangle "Opportunities" as O {
    note as O1
    note as O2
  }
  rectangle "Threats" as T {
    note as T1
    note as T2
  }
}

' Logical Grouping
group POSITIVE [Left Side]
  S
  O
endgroup

group NEGATIVE [Right Side]
  W
  T
endgroup
@enduml
Step-by-Step Modeling Strategy
- Container Definition: Create a main container for the “Strategic Analysis.”
- Partitioning: Divide the container into four distinct sub-regions. In Visual Paradigm, this is often done using the “Swimlane” feature or a “2×2 Matrix” widget.
- Labeling: Assign the labels “INTERNAL” and “EXTERNAL” to the vertical boundaries, and “POSITIVE” and “NEGATIVE” to the horizontal boundaries.
- Content Injection: Populate the “Strengths” quadrant with internal positive attributes (e.g., profitability, brand reputation).
Interpreting the Starbucks Data
The specific data points in the image illustrate how raw information is categorized into these technical quadrants.
- Strengths (Internal/Positive): The diagram notes Starbucks’ profitability and ethical mission. These are assets the company owns and controls.
- Weaknesses (Internal/Negative): The text mentions vulnerability to innovation faltering and dependence on the US market. These are internal structural flaws.
- Opportunities (External/Positive): The expansion into India and the Pacific Rim are external market trends the company can leverage.
- Threats (External/Negative): The rise of copycat brands and fluctuating coffee costs are external forces acting against the company.
By strictly categorizing these points, the diagram transforms a narrative into a structured dataset that can be analyzed for cross-correlation (e.g., “How do our Strengths help us mitigate these Threats?”).
Conclusion
The SWOT matrix is a powerful example of how qualitative business data is organized into a quantifiable, spatial model. By understanding the binary logic of the axes (Internal/External, Positive/Negative), you can effectively use diagramming tools to create not just static images, but dynamic maps of organizational strategy.