


When designing complex software systems, understanding the physical environment where code lives is just as critical as the code itself. 🏗️ This is where UML Deployment Diagrams come into play. These visual tools allow architects and developers to map the hardware and software nodes that make up a system’s infrastructure. By visualizing the deployment architecture, teams can ensure reliability, scalability, and security before writing a single line of production code.
Whether you are planning a cloud migration or designing an embedded system, knowing how to structure a deployment diagram provides clarity. This guide explores the core components, notation, and best practices for creating effective UML Deployment Diagrams. We will avoid jargon where possible and focus on the practical application of these diagrams in real-world engineering contexts.
🔍 What Is a UML Deployment Diagram?
A UML Deployment Diagram is a type of static structure diagram in the Unified Modeling Language (UML). It describes the physical architecture of a system. Unlike class diagrams which focus on logic, or sequence diagrams which focus on flow, deployment diagrams focus on infrastructure.
Think of it as a blueprint for the data center or the network topology. It shows:
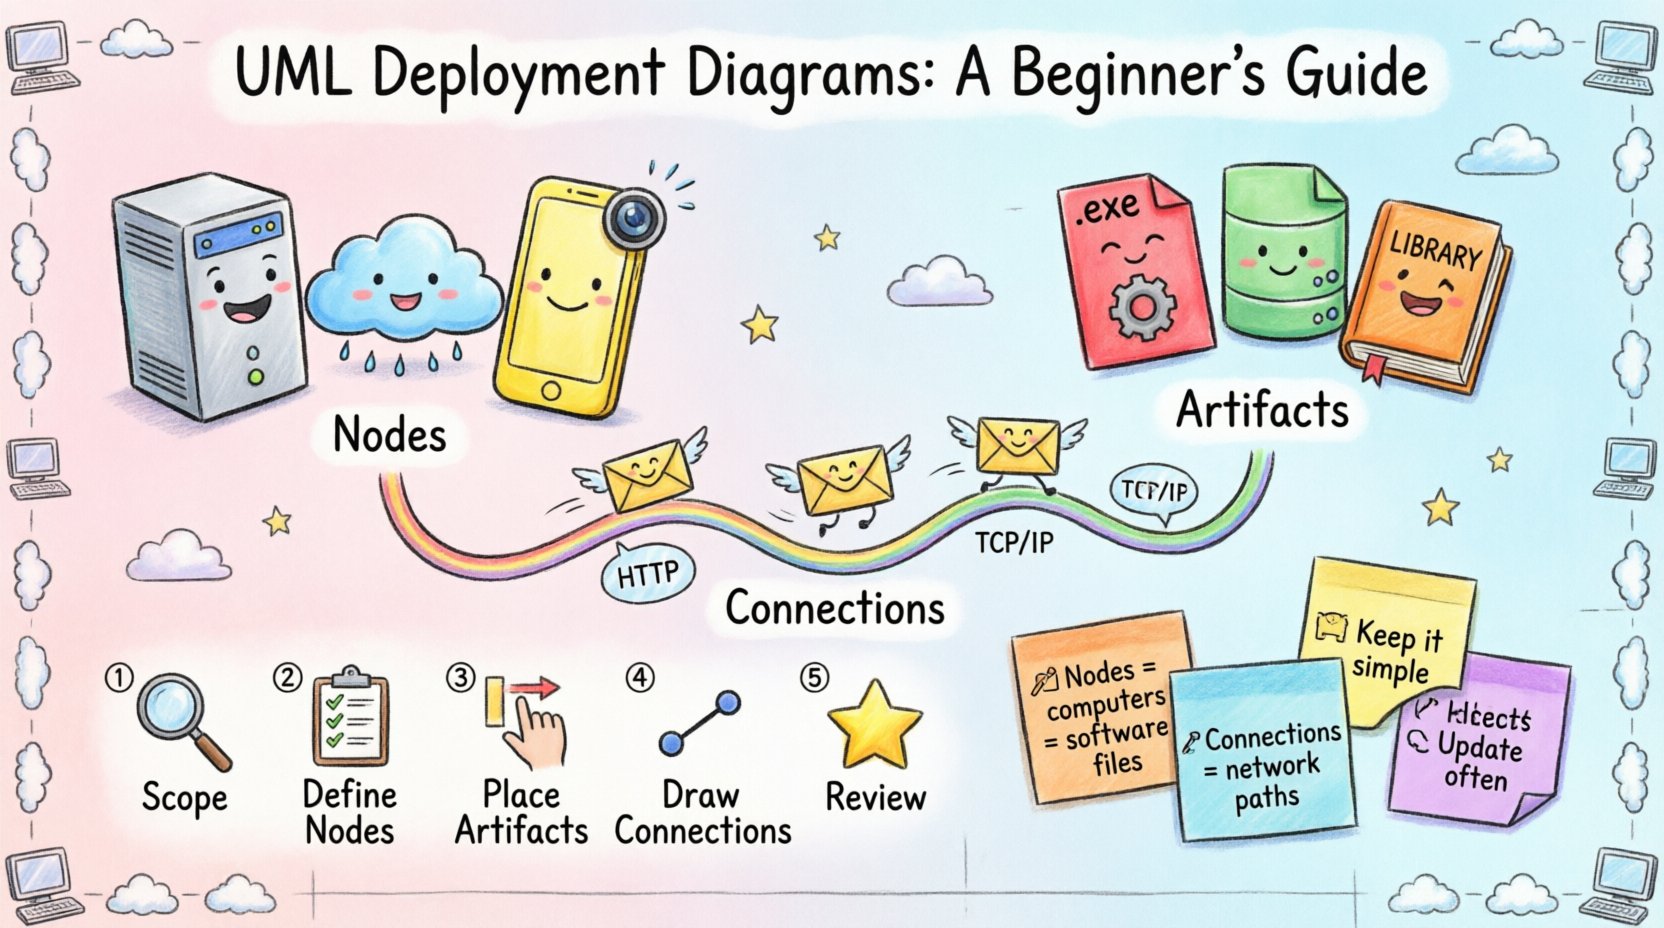
- 🖥️ Nodes: Physical or virtual computing resources (servers, workstations, routers).
- 📦 Artifacts: Software components running on the nodes (executables, libraries, databases).
- 🔗 Connections: How these nodes communicate (network links, protocols).
This visualization helps stakeholders understand where data resides and how it travels. It bridges the gap between the logical design (what the system does) and the physical implementation (where it runs).
🧱 Core Components of a Deployment Diagram
To construct a valid diagram, one must understand the building blocks. Each element serves a specific purpose in defining the runtime environment.
1. Nodes (Compute Resources)
Nodes represent the physical or virtual hardware. They are the containers for artifacts. In UML, a node is typically represented as a 3D cube or a rectangle with the stereotype <<node>>.
Common types of nodes include:
- Device: A physical computing resource with processing capability and memory. Examples include servers, smartphones, or IoT sensors. 📱
- Execution Environment: A virtual machine or container runtime that hosts artifacts. Examples include operating systems, application servers, or cloud instances.
- Artifact: A physical representation of a software component. It is deployed onto a node. Examples include .jar files, .exe files, or database schema files. 📄
2. Artifacts and Components
Artifacts are the tangible items that are installed or deployed. They are distinct from components, which are logical units. An artifact is what you actually download or copy to the server.
Key characteristics of artifacts include:
- They are deployed on nodes.
- They can be executed or stored.
- They may have dependencies on other artifacts.
3. Communication Paths
Nodes do not exist in isolation. They communicate via network connections. These paths define how data flows between infrastructure elements.
- Association: A structural relationship between nodes.
- Dependency: One node relies on another to function correctly.
- Communication Path: Explicitly defines the protocol or medium used (e.g., TCP/IP, HTTP, REST). 🌐
🎨 Symbols and Notation
Consistency is key in UML. Using standard symbols ensures that anyone reading the diagram understands the architecture immediately. Below is a table summarizing common notation elements.
| Symbol | Name | Meaning | Use Case |
|---|---|---|---|
| 🟦 Cube | Node | Physical hardware or virtual machine | Representing a server or router |
| 📄 Document | Artifact | Software file or data unit | Representing an executable or database |
| ➡️ Arrow | Dependency | Usage relationship | One artifact uses another |
| 🔗 Line | Association | Structural link | Nodes are connected |
🛠️ Steps to Create a Deployment Diagram
Creating a deployment diagram is an iterative process. It requires understanding the system requirements and mapping them to infrastructure. Follow this workflow to build a robust diagram.
Step 1: Identify the Scope
Before drawing, define the boundaries. Are you mapping the entire enterprise system or just a microservice? Scope determines the level of detail.
- 🔹 High-Level: Shows data centers and major regions.
- 🔹 Low-Level: Shows individual containers and specific network ports.
Step 2: Define the Nodes
List all the hardware or virtual machines involved. Categorize them by function. Common categories include:
- Client Nodes: Devices used by end-users (laptops, mobile phones).
- Application Servers: Where the business logic executes.
- Database Servers: Where persistent data is stored.
- Network Devices: Routers, firewalls, and load balancers.
Step 3: Place the Artifacts
Drag and drop the software components onto the appropriate nodes. Ensure that every artifact has a host. An artifact floating without a node is a modeling error.
- Group related artifacts together if they form a single unit.
- Use stereotypes to indicate the type of artifact (e.g., <<executable>>, <<database>>).
Step 4: Draw Connections
Link the nodes using communication paths. Specify the protocol if known. This helps in identifying potential bottlenecks or security risks.
- Draw lines between nodes that exchange data.
- Label the lines with protocol names (e.g., HTTPS, SQL).
- Indicate directionality where applicable (read vs. write).
Step 5: Review and Refine
Check the diagram against the requirements. Does it match the physical reality? Is it scalable? Remove unnecessary details that clutter the view.
📈 Best Practices for Effective Diagrams
A diagram is only useful if it is readable and maintainable. Adhering to best practices ensures the diagram serves its purpose throughout the project lifecycle.
1. Use Abstraction Levels
Do not try to show every single server in a cloud environment on one page. Use abstraction. A single box can represent a cluster of servers.
- Use a “Cluster” node to represent multiple identical nodes.
- Hide internal details unless they are relevant to the current discussion.
2. Consistent Naming Conventions
Names should be descriptive and consistent. Avoid abbreviations that are not industry standard.
- Good: “Customer-DB-Node-01”
- Bad: “Node A”
3. Document Protocols
Network security depends on knowing what traffic is allowed. Label your connections with the specific protocols used.
- Specify ports if critical (e.g., Port 443).
- Indicate encryption status (e.g., SSL/TLS).
4. Separate Concerns
If the system is complex, create multiple diagrams. One for the frontend infrastructure, one for the backend, and one for the database layer.
⚠️ Common Mistakes to Avoid
Even experienced architects make errors. Being aware of common pitfalls can save significant rework later.
Mistake 1: Mixing Logical and Physical
Do not mix logical components (like classes) with physical nodes. Keep the deployment diagram focused on infrastructure. If you need to show logic, use a Component Diagram.
Mistake 2: Ignoring Network Latency
Just because two nodes are connected doesn’t mean the connection is fast. In distributed systems, latency matters. Consider adding notes about network distance or bandwidth constraints.
Mistake 3: Over-Engineering
Do not detail every cable or switch unless it impacts the system design. Focus on the logical connectivity that affects deployment strategy.
Mistake 4: Static State
Infrastructure changes. A diagram that is not updated is misleading. Ensure the diagram is part of the version control process or documentation repository.
🔄 Integration with Other UML Diagrams
Deployment diagrams do not exist in isolation. They interact with other parts of the UML suite to provide a complete system view.
With Component Diagrams
Component diagrams show the logical organization of code. Deployment diagrams show where those components live. The deployment diagram maps the components from the component diagram onto nodes.
With Use Case Diagrams
Use case diagrams define user interactions. Deployment diagrams help identify which node handles the interaction. For example, a “Login” use case might run on the application server node.
With Sequence Diagrams
Sequence diagrams show the flow of messages over time. Deployment diagrams provide the context for those messages, showing which physical devices are sending and receiving data.
🌐 Cloud and Virtualization Considerations
Modern infrastructure often involves cloud providers and virtualization. The principles remain the same, but the terminology shifts slightly.
- Virtual Machines (VMs): Represented as nodes. They abstract the physical hardware.
- Containers: Lightweight execution environments. Often grouped under a single node.
- Serverless: Functions deployed without managing the underlying nodes. These are often represented as artifacts deployed to a specific runtime environment.
When mapping cloud infrastructure, consider:
- 📍 Regions: Physical geographic locations of data centers.
- 🔒 Availability Zones: Distinct locations within a region for redundancy.
- 🔐 Security Groups: Firewall rules that control traffic between nodes.
📝 Summary of Key Takeaways
UML Deployment Diagrams are essential for visualizing the physical infrastructure of a software system. They provide a clear view of how hardware, software, and network connections interact.
Key points to remember:
- 🛠️ Nodes represent the computing resources.
- 📦 Artifacts are the software files deployed on nodes.
- 🔗 Connections define the communication paths.
- 📝 Abstraction keeps the diagram readable.
- 🔄 Updates are necessary as infrastructure evolves.
By mastering these diagrams, teams can reduce deployment errors, improve security, and communicate architecture more effectively. The effort invested in creating a clear diagram pays off during system maintenance and scaling operations.
❓ Frequently Asked Questions
Q: Can I use a Deployment Diagram for a single server?
Yes. Even for a single server, showing the OS, the application, and the database on the same node helps clarify the local architecture.
Q: What is the difference between a Node and a Component?
A Component is a logical unit of software. A Node is a physical or virtual resource where the component runs. A Node can host multiple Components.
Q: How do I represent a firewall?
Firewalls are typically represented as a Node with a stereotype <<firewall>> or a Device node placed between other nodes to indicate a security boundary.
Q: Is this diagram useful for DevOps?
Absolutely. DevOps teams use these diagrams to understand deployment pipelines, infrastructure as code requirements, and monitoring boundaries.
Q: Do I need specific tools to draw this?
Any tool that supports UML standards will work. The focus should be on the content, not the specific software used to draw it.
Building a solid foundation in system architecture begins with understanding how to map it. UML Deployment Diagrams offer a standardized language for this task. By following these guidelines, you ensure that your infrastructure plans are clear, accurate, and ready for implementation.
")
