


Understanding how software lives on hardware is a critical skill for any developer. While code defines behavior, the deployment diagram defines location. This visual representation maps out the physical architecture of your system, showing how software components interact with the underlying infrastructure. For junior developers stepping into system design, mastering this diagram type bridges the gap between abstract logic and tangible reality.
This guide provides a deep dive into the UML Deployment Diagram. We will explore the core elements, the standard notation, and a structured approach to creating these diagrams for real-world projects. By the end of this reading, you will understand how to visualize system boundaries, hardware nodes, and communication paths without relying on specific tools.
🧩 What is a Deployment Diagram?
A Deployment Diagram is one of the structural diagrams in the Unified Modeling Language (UML). It depicts the physical deployment of artifacts on hardware nodes. Unlike a Class Diagram which shows logical relationships, or a Sequence Diagram which shows behavioral interactions over time, the Deployment Diagram focuses on the topology of the system.
- Scope: It covers the production environment, not just the development environment.
- Focus: It highlights the relationship between software components and the hardware or virtual resources that host them.
- Utility: It aids in capacity planning, network configuration, and understanding distributed systems.
Think of it as a blueprint for your infrastructure team. When a developer says, “The API runs on the server,” a Deployment Diagram clarifies which server, what operating system it uses, and how it talks to the database.
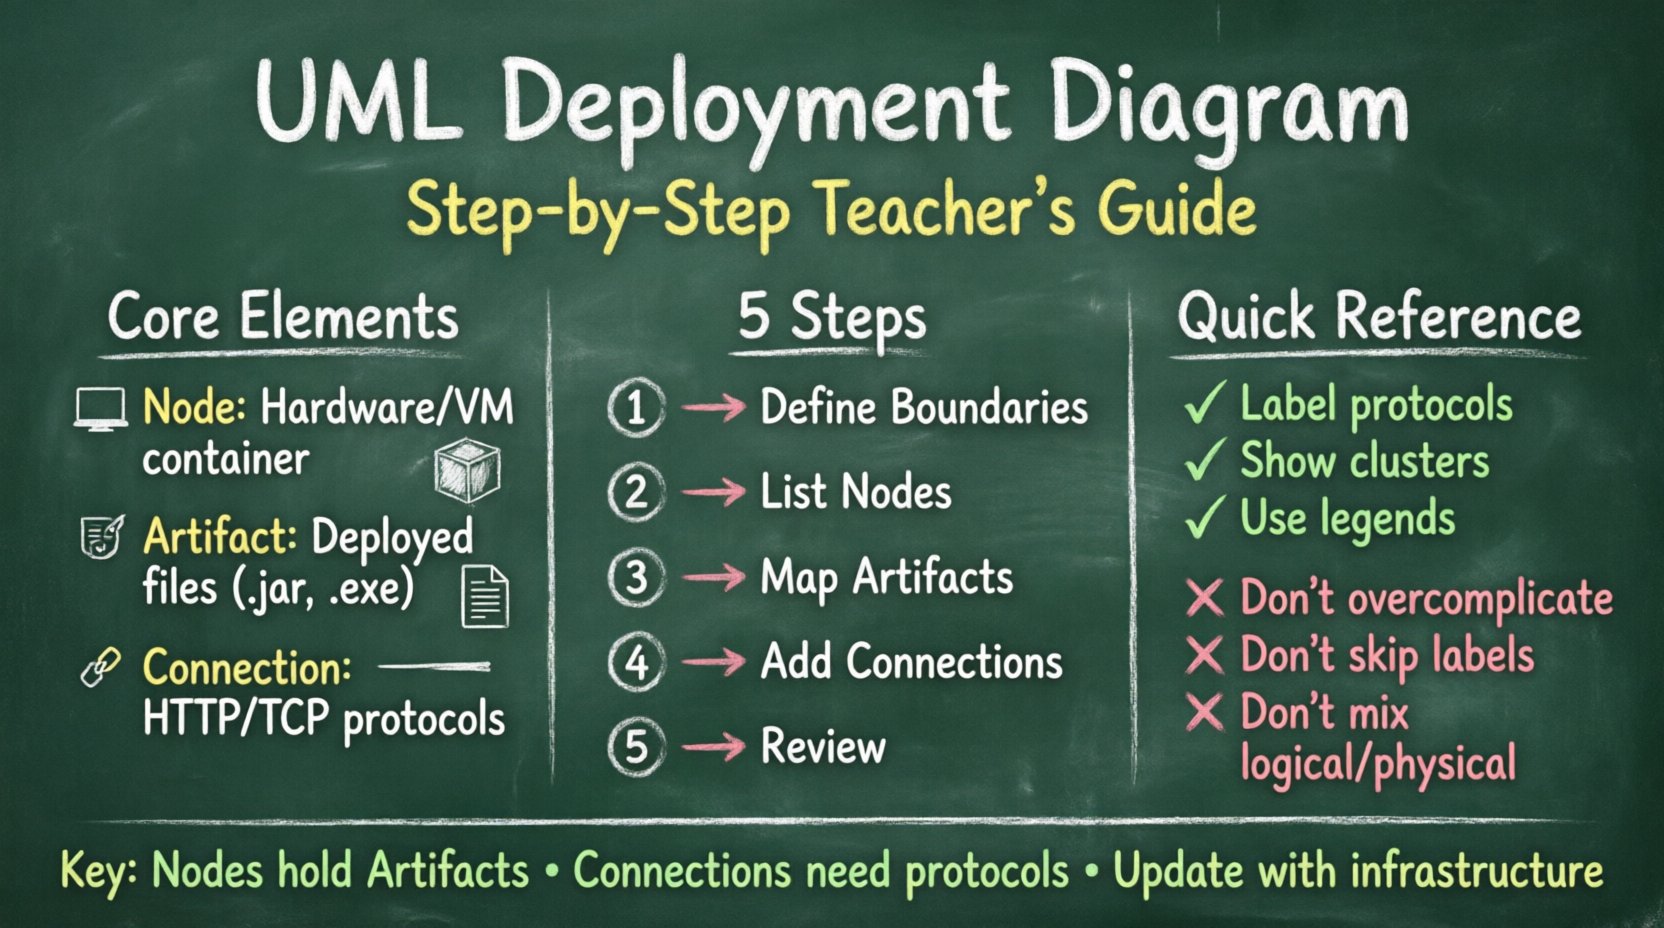
📐 Core Elements and Notations
To draw a Deployment Diagram effectively, you must understand the standard symbols. UML relies on specific stereotypes to convey meaning without cluttering the visual space.
1. Nodes 🖥️
A Node represents a computational resource. It is a physical or virtual device that executes software. Nodes are the containers in your diagram.
- Device: Represents physical hardware like a laptop, router, or sensor. Often depicted as a box with a small rectangle inside.
- Execution Environment: A software layer that provides a runtime environment for the node. Examples include a Java Virtual Machine (JVM) or a Linux Kernel.
- Artifact: The software files deployed onto the node.
2. Artifacts 📄
Artifacts represent the physical implementation units of software. These are the files that get copied, installed, or executed.
- Executable: Compiled code like .exe files, binaries, or scripts.
- Data: Static files, databases, or configuration files.
- Document: Technical specifications or user manuals.
3. Communication Paths 🔗
These are the lines connecting nodes. They represent the network or communication channel between systems.
- Protocol: The standard used for communication (e.g., HTTP, TCP/IP, REST).
- Direction: Lines can be unidirectional or bidirectional.
📊 Comparison of Deployment Elements
Understanding the distinctions between these elements prevents confusion when designing complex systems. Use the table below as a quick reference guide.
| Element | Category | Example | Visual Representation |
|---|---|---|---|
| Node | Hardware / Runtime | Web Server, Database Server | 3D Cube or Box |
| Artifact | Software File | Index.html, .jar file, SQL Script | Rectangle with folded corner |
| Link | Connection | Ethernet, Wi-Fi, Cloud Connection | Dashed or Solid Line |
| Interface | Contract | API Endpoint, Port | Lollipop or Socket Symbol |
🛠️ Step-by-Step Guide to Creating a Deployment Diagram
Creating a diagram is not just about drawing shapes; it is about modeling a system accurately. Follow this structured process to ensure your diagrams are useful for stakeholders and developers alike.
Step 1: Identify System Boundaries 🔍
Before drawing, define what is inside and outside the system. This helps determine which nodes to include.
- In-Scope: Servers you own, manage, or directly deploy to.
- Out-of-Scope: Third-party services (e.g., a payment gateway provider) which are often represented as external nodes.
Step 2: List Hardware Nodes 🖥️
Inventory the physical or virtual machines required. Consider the following:
- Client Side: User devices like mobile phones, desktops, or tablets.
- Server Side: Application servers, load balancers, and database servers.
- Network Devices: Firewalls, routers, and switches.
For each node, define its specifications. Does it run Windows or Linux? Is it a virtual machine or a bare-metal server? This information is crucial for the deployment strategy.
Step 3: Map Software Artifacts 📦
Place the software components onto the nodes. This step connects the code to the infrastructure.
- Frontend: Static files (HTML, CSS, JS) usually go to a web server or CDN.
- Backend: Application logic (Java, Python, Node) goes to application servers.
- Data: Database schemas and files go to database servers.
Ensure that every artifact has a home. If a file is listed but has no node, it is floating in the system, which indicates a design flaw.
Step 4: Define Communication Paths 🔌
Connect the nodes using lines that represent data flow. Specify the protocol used for communication.
- Internal Traffic: High-speed connections within a data center (e.g., TCP/IP).
- External Traffic: Internet traffic (e.g., HTTPS, REST).
- Security: Indicate if the path is encrypted or unencrypted.
Labeling these paths with protocol names (like HTTP/1.1 or gRPC) adds significant value for network engineers reviewing the diagram.
Step 5: Review and Refine 🔄
Once drawn, validate the diagram against requirements.
- Redundancy: Are there single points of failure? If a node is critical, should there be a backup node?
- Scalability: Can this diagram show how the system grows? (e.g., adding more application servers).
- Clarity: Is the layout readable? Avoid crossing lines where possible.
🧠 Advanced Concepts for Scalable Systems
As you progress from simple applications to distributed systems, your diagrams must evolve. Here are advanced concepts to keep in mind.
1. Clusters and Load Balancing
In modern architectures, you rarely have a single server handling all requests. You have clusters. A Deployment Diagram should show a Load Balancer distributing traffic across multiple Application Nodes. This visualizes high availability.
- Visual Tip: Group multiple identical nodes together using a stereotype or a boundary box labeled “Cluster”.
- Benefit: Shows that the system can survive the loss of one node without going down.
2. Virtualization and Containers
Containers (like Docker) and Virtual Machines (VMs) add layers of abstraction. A single physical server might host multiple container nodes.
- Representation: You can draw a large Node box containing smaller inner boxes representing container instances.
- Context: This helps distinguish between physical hardware limits and virtual resource allocation.
3. External Systems and APIs
Your system rarely operates in a vacuum. It interacts with external services.
- Third-Party Nodes: Represent these as distinct nodes outside your main boundary.
- Interfaces: Clearly mark where the API calls enter and leave your system.
- Security: Highlight secure connections (HTTPS) versus internal trust connections.
⚠️ Common Mistakes to Avoid
Even experienced architects make errors. For junior developers, avoiding these common pitfalls ensures your documentation remains accurate.
- Over-Complicating: Do not try to show every microservice in one diagram. Use subsystems or separate diagrams for complex architectures.
- Ignoring Latency: A diagram is static, but networks are dynamic. If a database is in a different region than the application, note that in the description.
- Missing Protocols: A line without a label is useless. Always specify if it is HTTP, FTP, or a proprietary protocol.
- Confusing Logical with Physical: Do not mix Class Diagram concepts (like inheritance) with Deployment concepts. Keep the focus on hardware and deployment.
- Static Snapshots: Remember that this diagram represents a point in time. Cloud environments change rapidly. Document versioning is key.
🔗 Integration with Other UML Diagrams
A Deployment Diagram does not exist in isolation. It works in tandem with other diagrams to provide a complete system view.
1. Relationship with Component Diagrams
Component Diagrams show the software structure. Deployment Diagrams show where those components live. You should be able to trace a component from the logical diagram to a specific artifact on a node in the deployment diagram.
2. Relationship with Sequence Diagrams
Sequence Diagrams show interactions over time. Deployment Diagrams show the actors involved in those interactions. If a Sequence Diagram shows a request going from a Client to a Server, the Deployment Diagram confirms that both exist as valid nodes.
3. Relationship with Class Diagrams
Class Diagrams define the data model. Deployment Diagrams define where the database storing that data resides. This ensures the database schema is understood in the context of the storage hardware.
🌍 Real-World Scenarios
Let’s look at how these diagrams apply to actual development contexts.
Scenario 1: The Startup MVP
A new startup launches a web application. They start with a single cloud server.
- Nodes: One Virtual Machine.
- Artifacts: Web Server software, Database software, Application code.
- Link: Direct connection from Client to VM.
This simple diagram helps the team understand that scaling will require adding more VMs later.
Scenario 2: The Enterprise System
A large corporation needs a secure system with multiple tiers.
- Nodes: Load Balancer, Web Tier (3 nodes), App Tier (3 nodes), DB Tier (2 nodes).
- Artifacts: Separate artifacts for each tier.
- Links: Firewalls between tiers. Encrypted links for external traffic.
Here, the diagram acts as a security document. It shows that the Database is not directly accessible from the internet.
📝 Best Practices for Documentation
Documentation is a living artifact. To keep it useful, follow these practices.
- Consistency: Use the same icons and colors for the same types of nodes across all diagrams in the project.
- Version Control: Store your diagrams in the same repository as your code. Update them when the infrastructure changes.
- Legend: Always include a legend if you use custom symbols or specific colors for security levels.
- Collaboration: Review diagrams with the DevOps team. They know the infrastructure best and can validate your assumptions.
🎓 Summary of Key Takeaways
Creating a Deployment Diagram is about mapping the abstract to the concrete. It requires a clear understanding of both software components and hardware constraints. By following the steps outlined above, you can produce diagrams that are accurate, scalable, and valuable to your entire team.
- Focus on Nodes: Know what hardware or runtime you are deploying to.
- Define Artifacts: Be specific about the files and data involved.
- Label Connections: Never leave a communication path unlabeled.
- Think in Layers: Distinguish between physical hardware and virtual environments.
- Keep it Updated: Infrastructure changes, so your diagrams must change with it.
As a junior developer, taking the initiative to document your system’s deployment architecture demonstrates maturity and foresight. It shifts your perspective from writing code to building systems. Use this guide as a foundation, and continue to refine your skills as you encounter more complex infrastructures.

