


Introduction
In the modern software development lifecycle, documentation often lags behind implementation. Visual diagrams drift out of sync with code, leading to “documentation debt” and architectural confusion. Diagram-as-Code (DaC) solves this by treating visual models as text files—versionable, reviewable, and automatable just like source code.
VPasCode, developed by Visual Paradigm, is a unified, browser-based DaC platform that aggregates the world’s most powerful text-to-diagram engines into a single interface. Instead of juggling multiple plugins or local installations, VPasCode allows engineers, architects, and analysts to write scripts in languages like PlantUML, Mermaid, D2, and Graphviz, rendering them instantly into professional visuals. This guide explores how to leverage these engines within VPasCode to streamline your system design and documentation workflows.
Key Concepts: What is Diagram-as-Code?
Diagram-as-Code is a methodology where diagrams are generated from textual descriptions rather than drawn manually with a mouse.
-
Version Control Friendly: Because diagrams are text (
.puml,.mmd,.d2), they can be stored in Git. You can see exactly what changed in a system architecture between commits using standarddifftool. -
AI-Ready: As seen in the VPasCode interface, the “AI Generate” feature leverages Large Language Models to convert natural language prompts directly into diagram syntax, drastically reducing the time spent on boilerplate code.
-
Unified Rendering: VPasCode removes the friction of context switching. Whether you need a UML sequence diagram or a data visualization chart, the engine handles the rendering logic in the browser.
Deep Dive: Supported Engines & Examples
VPasCode supports a diverse ecosystem of modeling languages. Below is a breakdown of the primary engines visible in the tool’s sidebar, along with use cases and code examples.
1. PlantUML: The Enterprise Standard
PlantUML is the heavyweight champion for formal software modeling. It is extensively used for UML (Unified Modeling Language) diagrams, including component, deployment, and sequence diagrams. In the provided screenshot, we see a C4 Container Diagram rendered via PlantUML, describing an “Internet Banking System.”
-
Best For: Complex system architecture, C4 models, and strict UML compliance.
-
Example (Sequence Diagram):
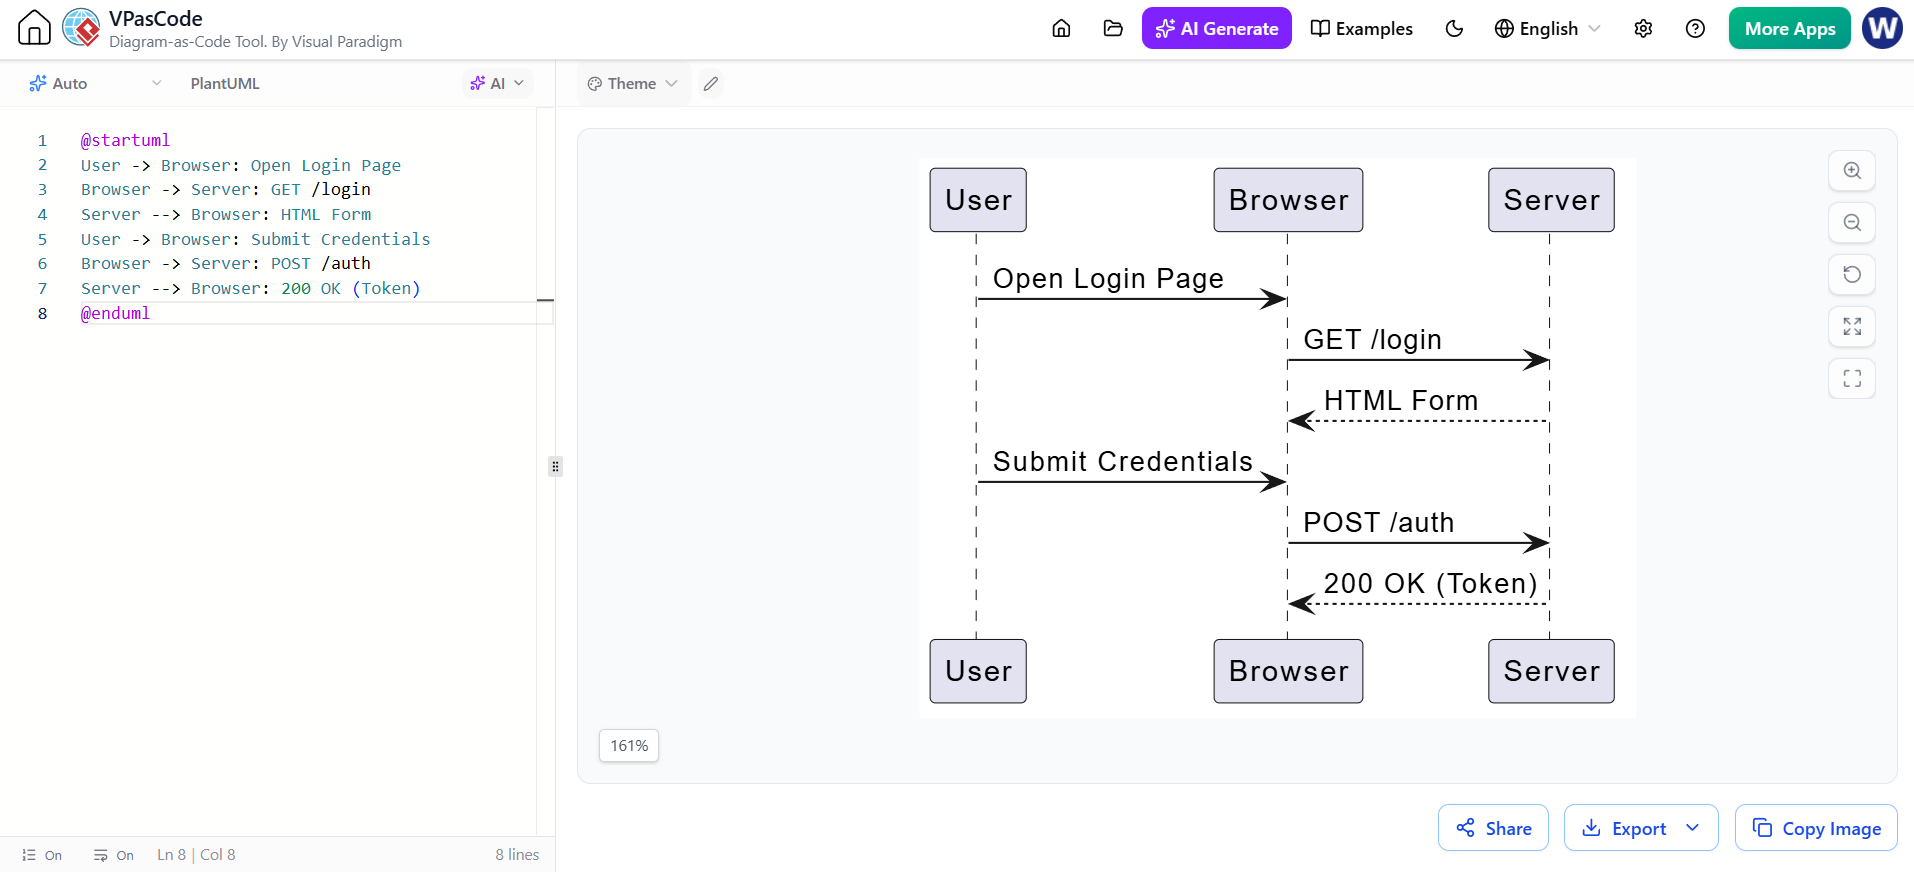
@startuml
User -> Browser: Open Login Page
Browser -> Server: GET /login
Server --> Browser: HTML Form
User -> Browser: Submit Credentials
Browser -> Server: POST /auth
Server --> Browser: 200 OK (Token)
@enduml
2. Mermaid: The Markdown Native
Mermaid has become ubiquitous due to its native support in GitHub, GitLab, and Notion. It uses a Markdown-inspired syntax that is approachable for beginners and powerful enough for flowcharts, Gantt charts, and entity-relationship diagrams.
-
Best For: Quick documentation, README files, and agile workflow visualization.
-
Example (Flowchart):
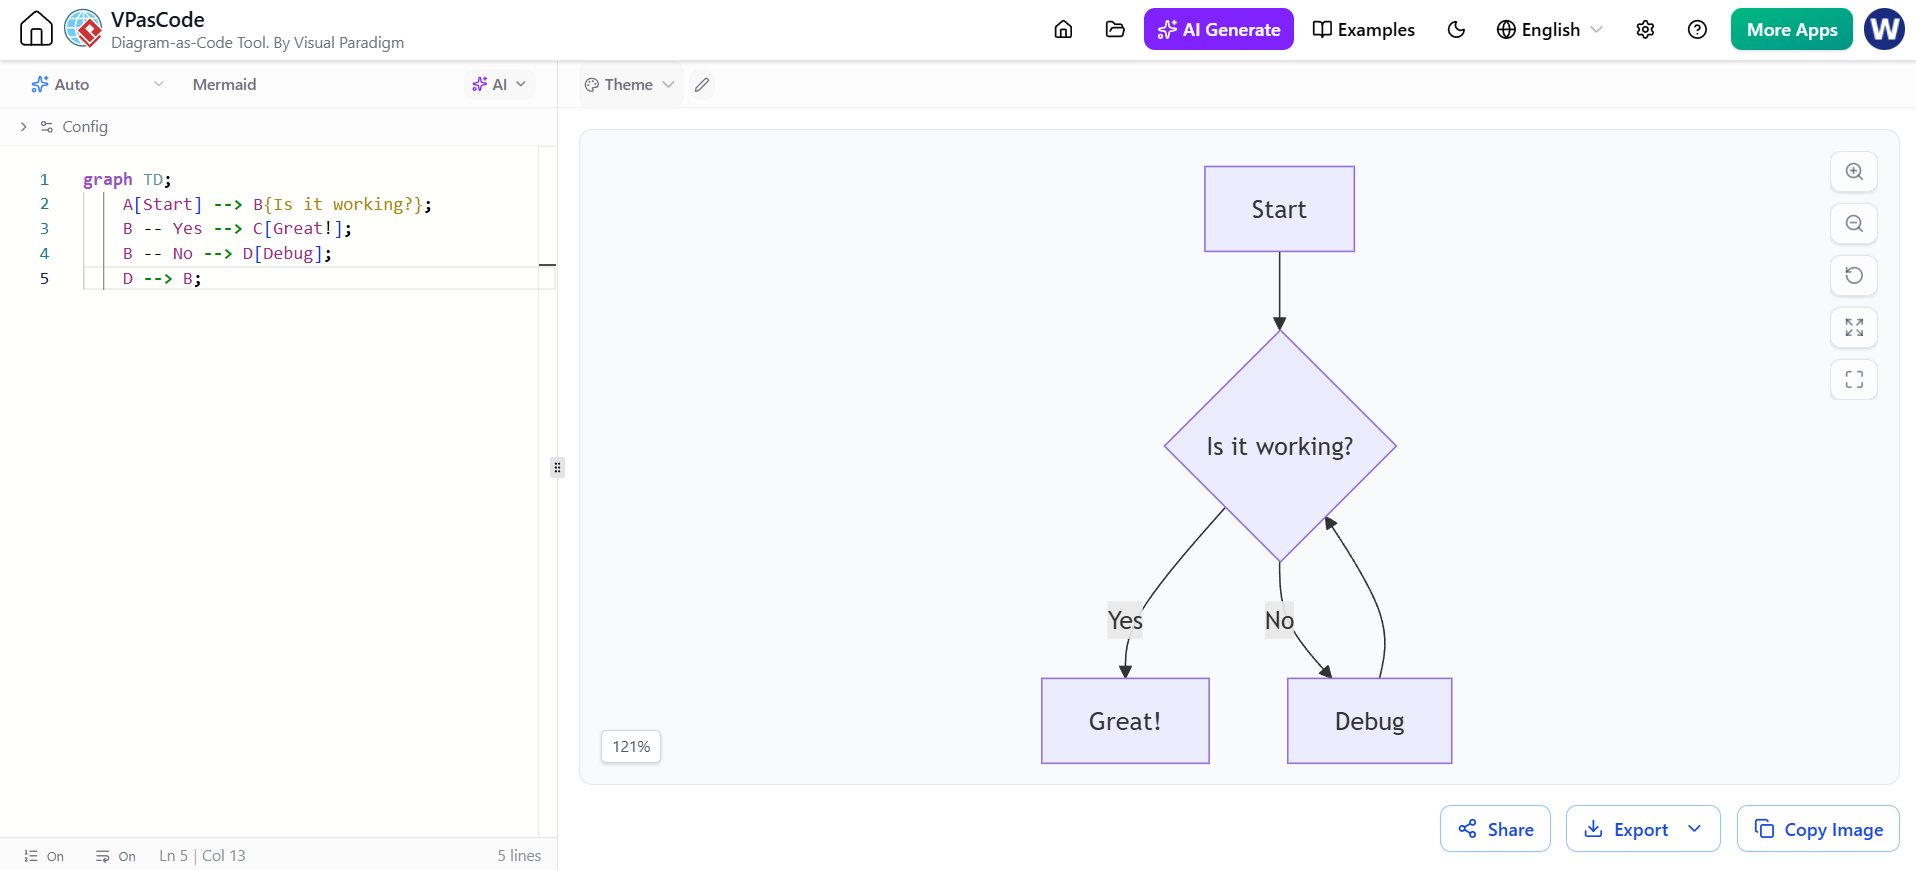
graph TD;
    A[Start] --> B{Is it working?};
    B -- Yes --> C[Great!];
    B -- No --> D[Debug];
    D --> B;
3. D2 (Declarative Diagramming): The Modern Contender
D2 is a newer entrant designed specifically for the modern developer experience. It focuses on aesthetics and readability, offering a cleaner syntax than Graphviz and better default themes than PlantUML . It excels at creating high-fidelity diagrams that look good in presentations without manual tweaking.
-
Best For: High-level architecture overviews, network diagrams, and presentation-ready visuals.
-
Example:
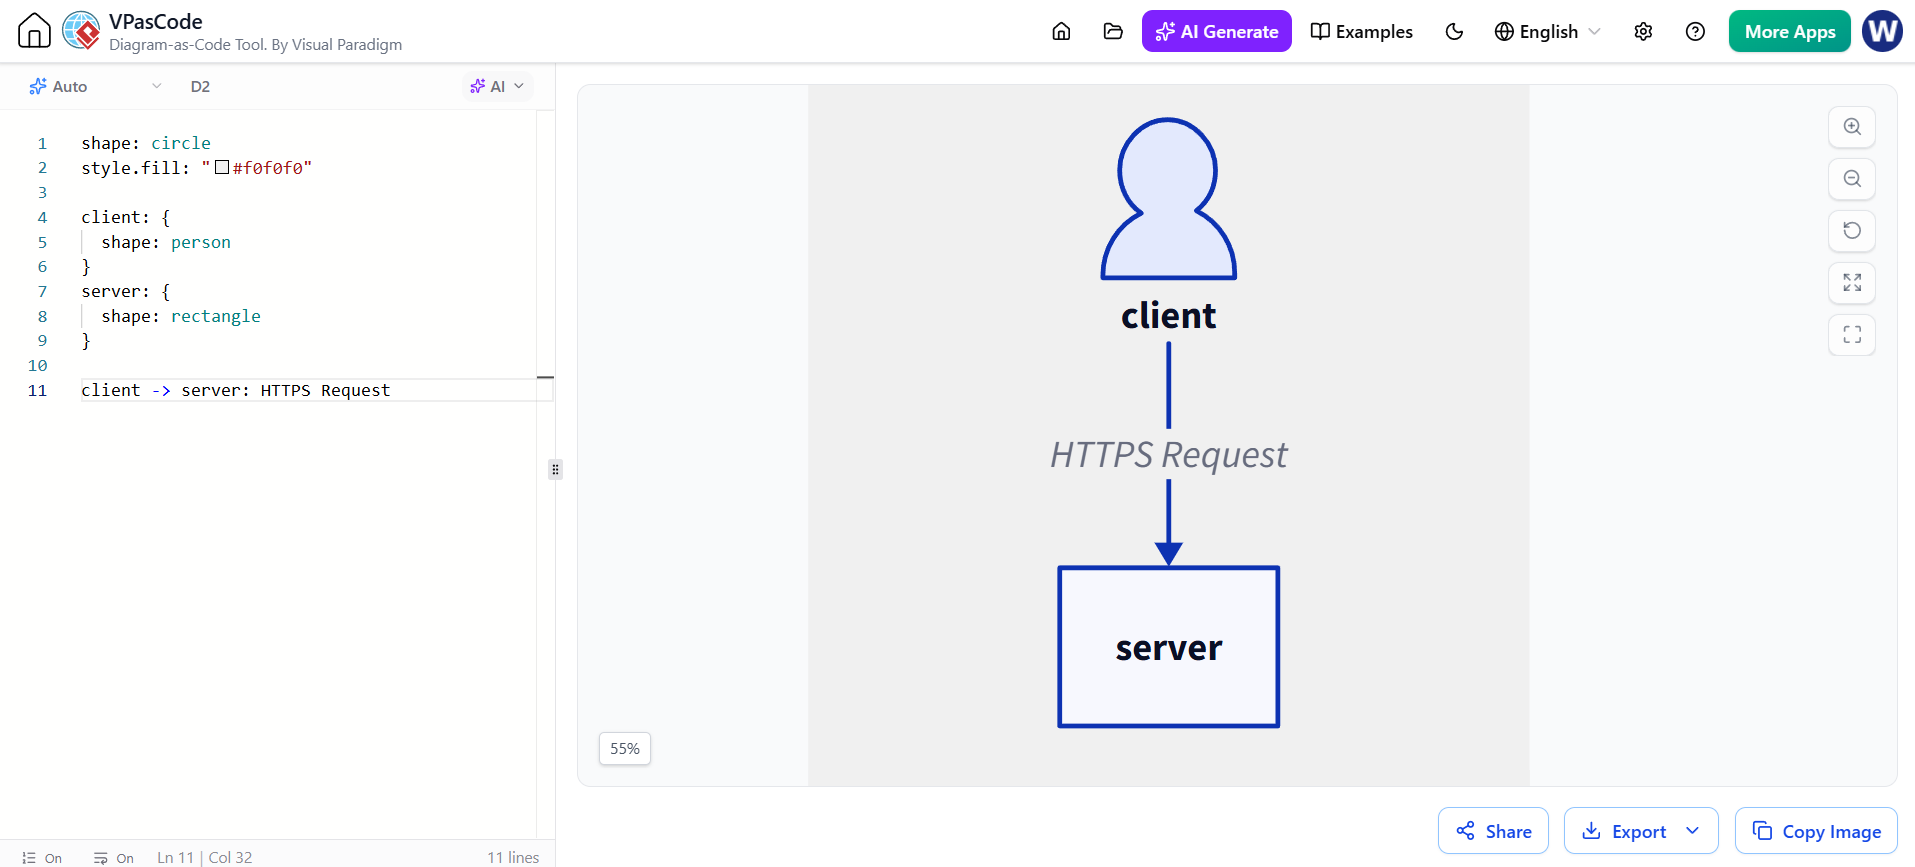
shape: circle
style.fill: "#f0f0f0"

client: {
  shape: person
}
server: {
  shape: rectangle
}

client -> server: HTTPS Request
4. Graphviz: The Algorithmic Layout Engine
Graphviz uses the DOT language to describe graphs. Unlike other tools where you might hint at layout, Graphviz uses sophisticated algorithms (like Dot, Neato, Twopi) to automatically arrange nodes to minimize edge crossings and optimize readability. It is the engine behind many other visualization tools.
-
Best For: Massive dependency graphs, state machines, and data structures where automatic layout is critical.
-
Example:
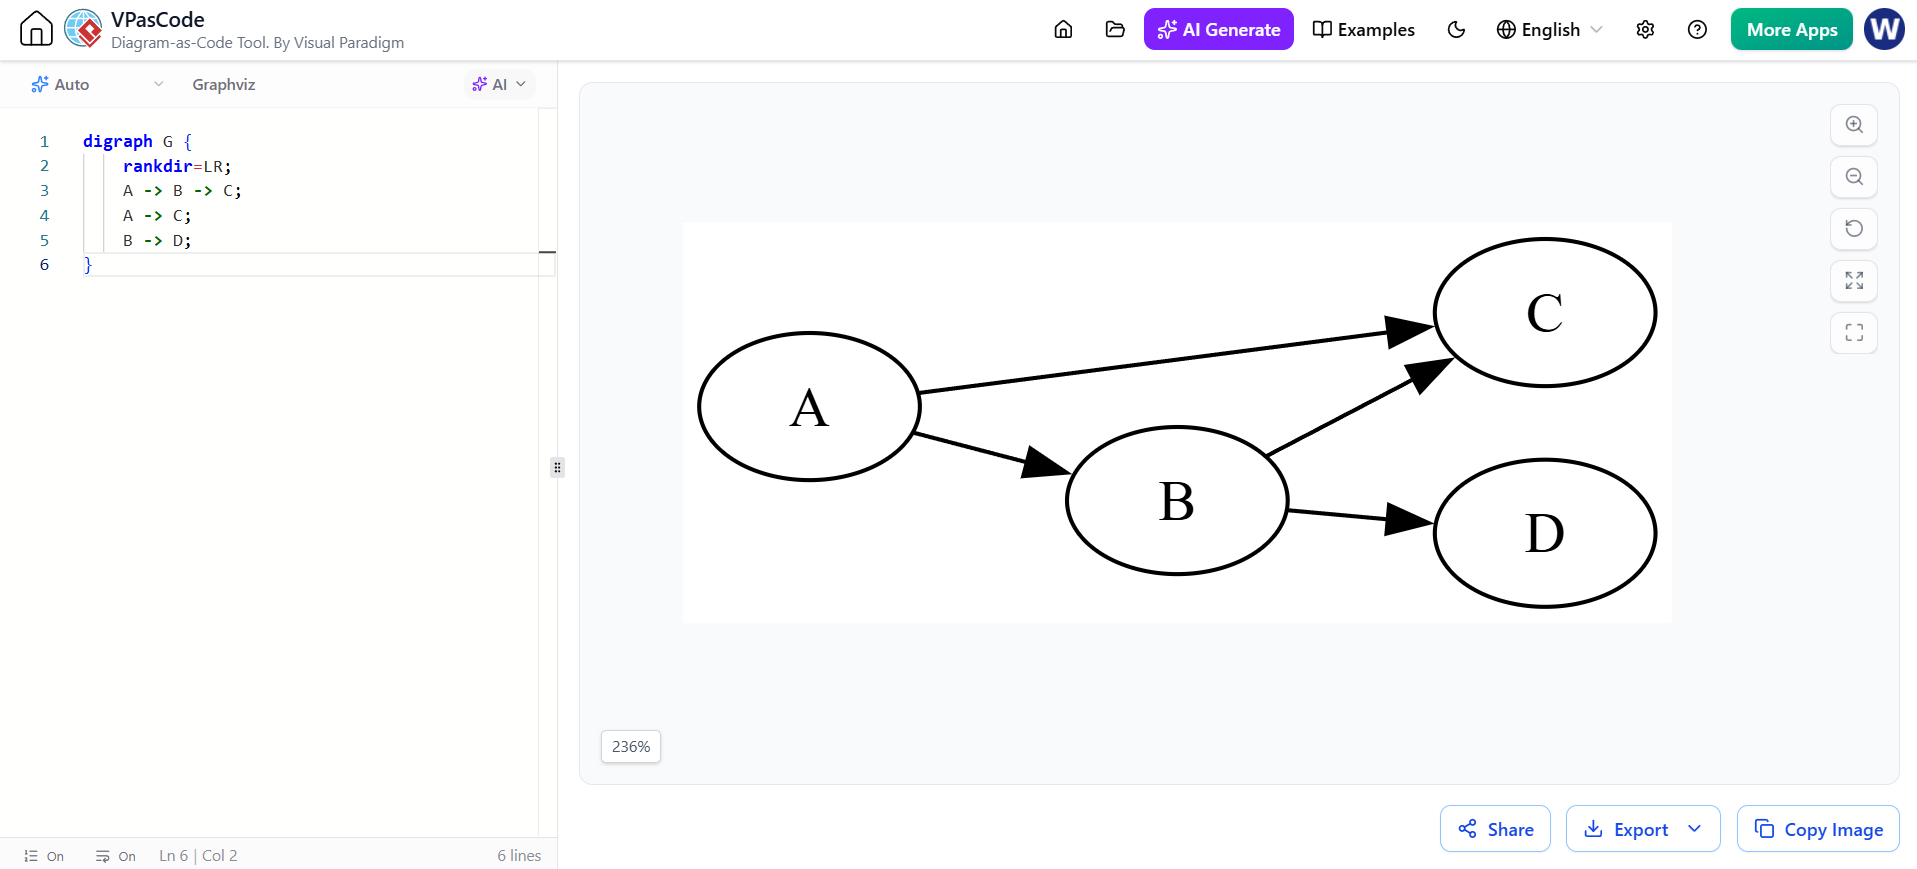
digraph G {
    rankdir=LR;
    A -> B -> C;
    A -> C;
    B -> D;
}
5. Markmap: Knowledge Visualization
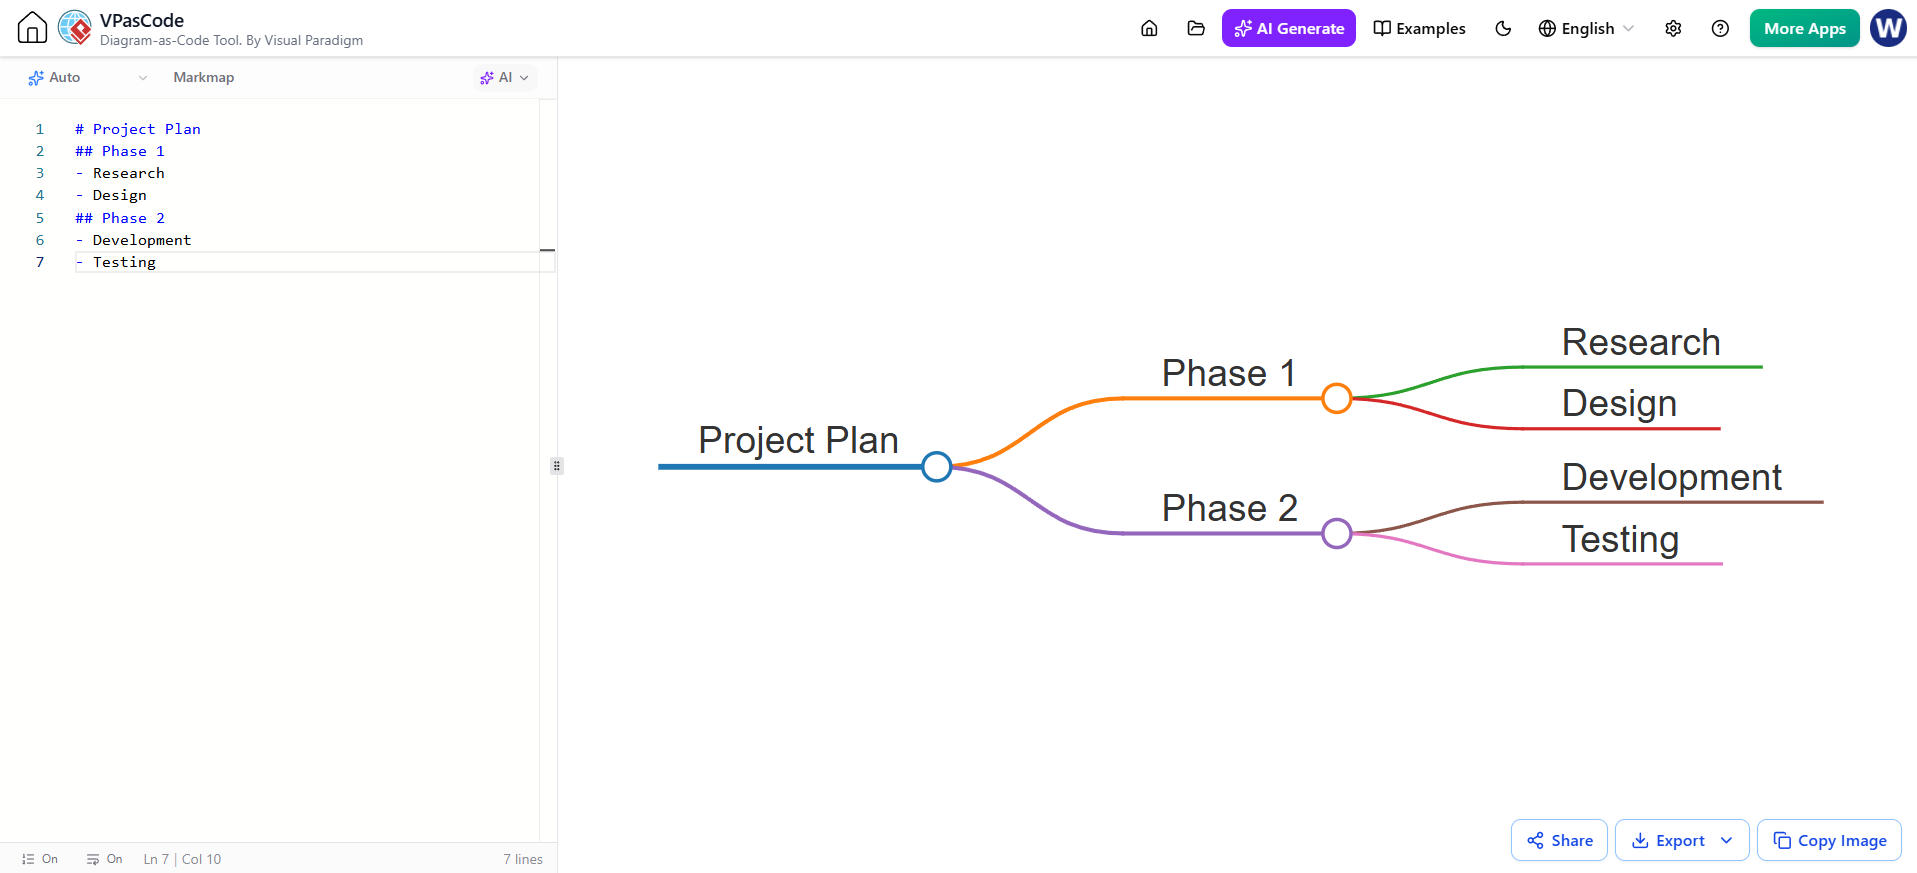
Markmap parses standard Markdown headers and lists to generate interactive mind maps. It is an excellent tool for brainstorming, summarizing long documents, or visualizing project hierarchies.
-
Best For: Brainstorming sessions, note-taking, and summarizing documentation.
-
Example:
-
# Project Plan
## Phase 1
- Research
- Design
## Phase 2
- Development
- Testing
6. ECharts: Data-Driven Visualization
While the other tools focus on structural diagrams, Apache ECharts is a powerful library for statistical data visualization. It supports canvas/SVG rendering and can handle massive datasets interactively.
-
Best For: Dashboards, financial reporting, and complex data analytics.
-
Example (JSON Config Snippet):
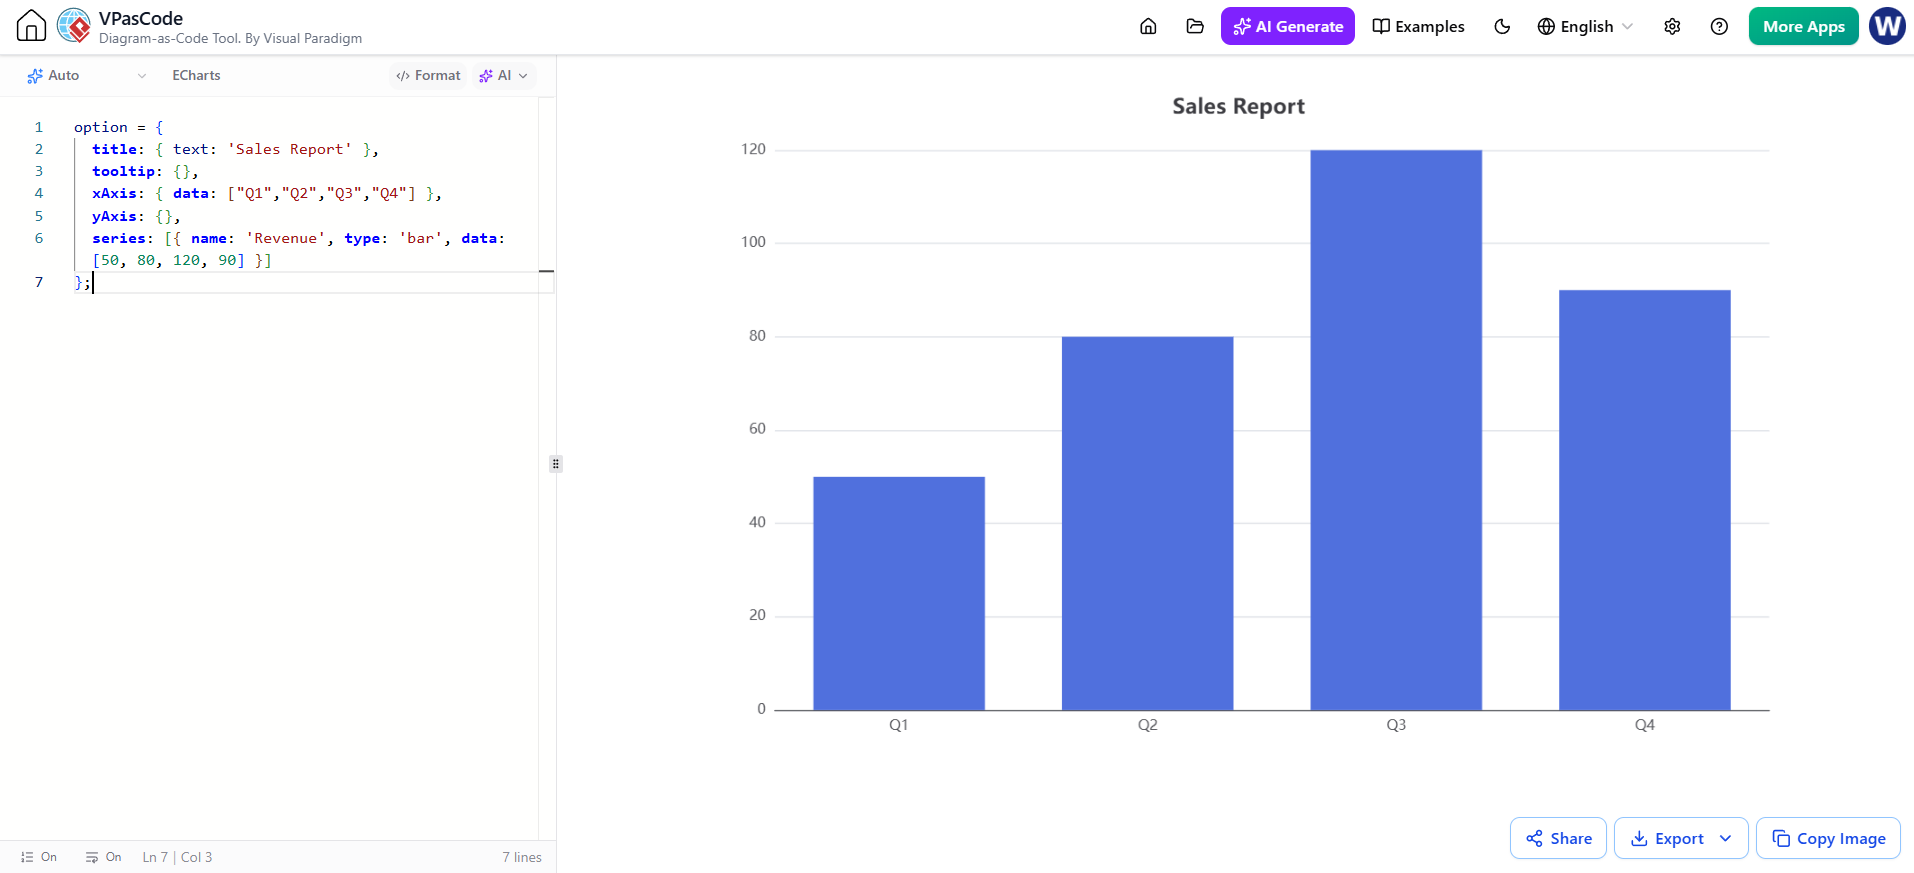
option = {
  title: { text: 'Sales Report' },
  tooltip: {},
  xAxis: { data: ["Q1","Q2","Q3","Q4"] },
  yAxis: {},
  series: [{ name: 'Revenue', type: 'bar', data: [50, 80, 120, 90] }]
};
How to Choose the Right Engine in VPasCode
| Requirement | Recommended Engine | Why? |
|---|---|---|
| Strict UML / C4 Architecture | PlantUML | Deepest support for formal software engineering standards. |
| Documentation / Wikis | Mermaid | Renders natively in most modern Git platforms and wikis. |
| Aesthetics / Presentations | D2 | Modern defaults and cleaner syntax require less styling code. |
| Complex Dependencies | Graphviz | Superior automatic layout algorithms for dense node connections. |
| Brainstorming / Notes | Markmap | Instantly turns outlines into navigable mind maps. |
| Statistical Data | ECharts | Purpose-built for interactive charts and big data rendering. |
Conclusion
The shift toward Diagram-as-Code represents a maturation of software documentation practices. By adopting tools like VPasCode, teams can ensure their visual artifacts remain living, breathing parts of the codebase rather than static images that rot over time. Whether you are mapping a microservices architecture with PlantUML, visualizing a git flow with Mermaid, or plotting analytics with ECharts, the ability to define visuals as text unlocks automation, version control, and AI-assisted generation.
As demonstrated by the “Internet Banking System” example in the VPasCode interface, complex container relationships can be defined in just a few lines of code, resulting in clear, maintainable, and shareable architecture diagrams. Start by converting your most critical system overview into code today—your future self (and your reviewers) will thank you.