Introduction
In today’s complex organizational landscape, the ability to document, analyze, and improve business processes is not just a best practice—it is a necessity. Whether you are aiming for Six Sigma improvements, Lean efficiency, or simply trying to clarify roles within your team, the first step is always documentation. But how do you document a process effectively?
Enter BPMN (Business Process Model and Notation). Created by the Object Management Group (OMG), BPMN has become the global standard for graphically documenting business processes. While the official specification spans over 500 pages and contains more than 100 objects, you do not need to master every single element to be effective. In fact, approximately 50% of the palette is reserved for technical execution, while the core 25–30 symbols are sufficient to document 90–95% of all business processes.
This guide serves as a practical roadmap to understanding BPMN. We will explore why you should use it, what it is used for, and how to apply it using a layered approach, illustrated through a comprehensive case study of a Café’s beverage ordering system.
1. Why and When to Use BPMN
Why BPMN?
BPMN is widely adopted because it bridges the gap between business users who design processes and IT professionals who implement them. Its standardized notation ensures that a diagram created in San Francisco can be understood by a developer in London without ambiguity. Furthermore, the rise of Business Process Management Suites (BPMS) relies on BPMN to execute processes automatically.
What is BPMN Used For?
BPMN is specifically designed to document how a process operates. It visualizes:
-
Who is involved (Participants/Roles).
-
The flow of activities from start to finish.
-
The interactions between different departments or external parties.
It is not typically used for high-level strategic decomposition (like value chain mapping) but rather for detailed operational workflows.
How to Approach Learning BPMN
Do not attempt to learn all 100+ symbols at once. Adopt a layered approach:
-
Descriptive Models: Use a limited subset (~25 symbols) for high-level overviews.
-
Analytic Models: Expand the subset to capture complex logic, exceptions, and data flows.
2. Core Components of BPMN
BPMN diagrams are constructed using five basic categories of elements. Understanding these categories is the foundation of effective modeling.
2.1 Swim Lanes: Defining Participants
Swim lanes define who is performing the work. They are divided into Pools and Lanes.
-
Pool: Represents a major participant (e.g., a Customer, a Supplier, or a specific Department like “Café Operations”). Pools are independent; process flow cannot cross pool boundaries directly (only via messages).
-
Lane: Represents a specific role or position within a Pool (e.g., “Barista” or “Cashier” within the “Café Operations” Pool).
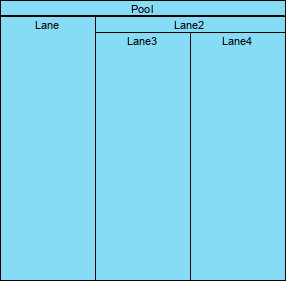
Figure: Example of BPMN Symbols used for Lanes and Sub-Lanes
Best Practice: Use “Black Box” pools for external entities (where internal details are hidden) and “White Box” pools for internal departments where you want to show detailed workflows.
2.2 Flow Objects: The Heart of the Process
Flow objects describe what happens in the process. There are three main types:
A. Events
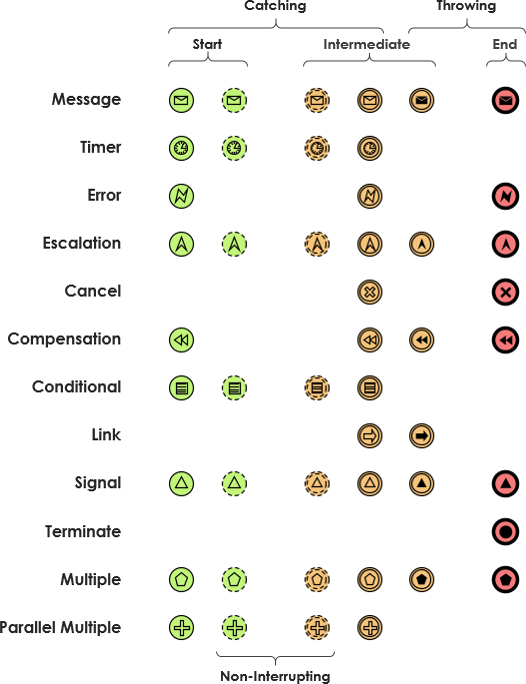
Events represent something that “happens.” They are circles with thin borders.
-
Start Event: Triggers the process (Single thin border).
-
Intermediate Event: Occurs during the process (Double thin border).
-
End Event: Concludes the process (Thick border).

Figure: BPMN Symbol for a Start Event

Figure: BPMN Symbol for an Intermediate Event

Figure: BPMN Symbol for an End Event
Event Triggers: Events can be triggered by various factors, such as:
-
Message: Receipt of information.
-
Timer: A specific time or duration.
-
Error/Escalation: Exception handling.
B. Activities
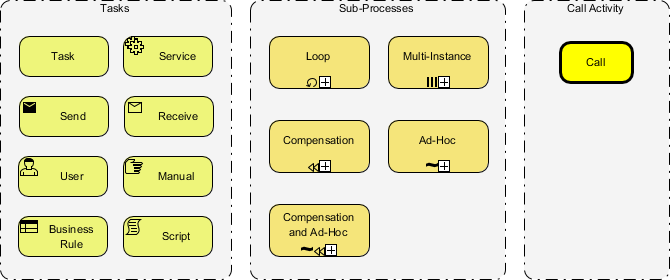
Activities represent work performed. They are rectangles with rounded corners.
-
Task: An atomic activity that cannot be broken down further.
-
Sub-Process: A compound activity that contains other tasks and flows. It can be Collapsed (hidden detail, shown with a
+) or Expanded (details visible).
Task Types:
-
User Task: Performed by a person.
-
Service Task: Performed by an automated system.
-
Send/Receive Task: Specifically for sending or receiving messages.
C. Gateways
Gateways control the flow, acting as decision points. They are diamond-shaped.
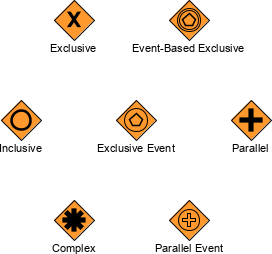
Figure: Gateway Types
-
Exclusive Gateway (XOR): Only one path is taken based on a condition (e.g., “Is the coffee hot?”).
-
Inclusive Gateway (OR): One or more paths can be taken.
-
Parallel Gateway (AND): All paths are taken simultaneously.
-
Event-Based Gateway: Path selection depends on which event occurs first (e.g., waiting for either a message or a timer timeout).
2.3 Data Objects
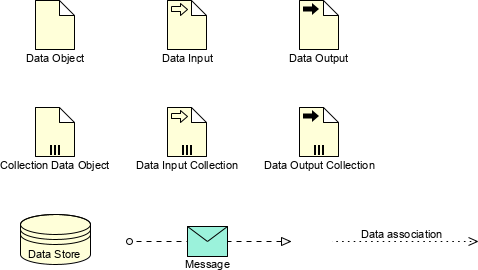
Data objects show information used or created by the process.
-
Data Object: Temporary data (document icon).
-
Data Store: Persistent data (cylinder icon).
-
Message: Communication between pools (envelope icon).
2.4 Connecting Objects
These lines connect the elements above.
-
Sequence Flow: Solid line with solid arrow. Shows the order of activities within a pool.
-
Message Flow: Dashed line with open circle and open arrow. Shows communication between pools.
-
Association: Dashed line. Connects data or artifacts to flow objects.
2.5 Artifacts
Artifacts add context without affecting flow.
-
Group: Dashed rectangle to group related elements.
-
Annotation: Open rectangle for adding notes.
Core Notation Summary
3. Types of BPMN Diagrams
BPMN supports different diagram types depending on the level of detail required.
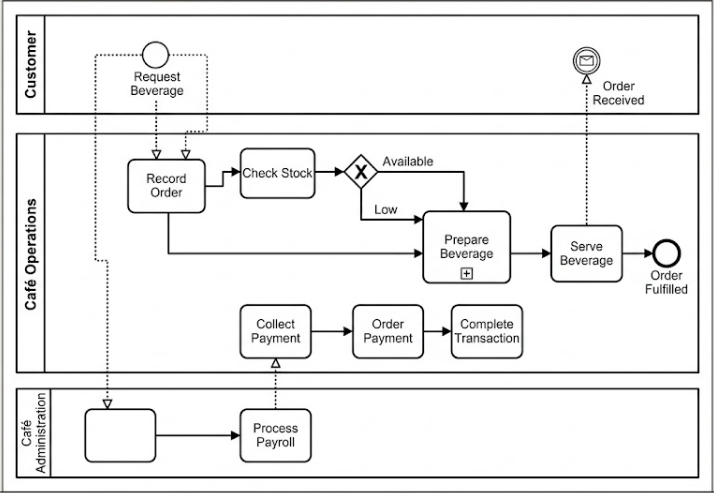
3.1 Collaboration Diagrams
These diagrams show interactions between multiple participants (Pools). They provide the “big picture” of how different departments or external parties interact.
-
Use Case: High-level overview of the entire business area.
-
Model Type: Typically Descriptive.

Figure 3: Example of Collaboration Diagram showing Customer, Café Operations, and Administration.
3.2 Process Diagrams
These diagrams detail the internal workflow of a single participant (Single Pool). They break down the sub-processes identified in the Collaboration Diagram.
-
Use Case: Detailed instructions for a specific role or department.
-
Model Type: Typically Analytic.
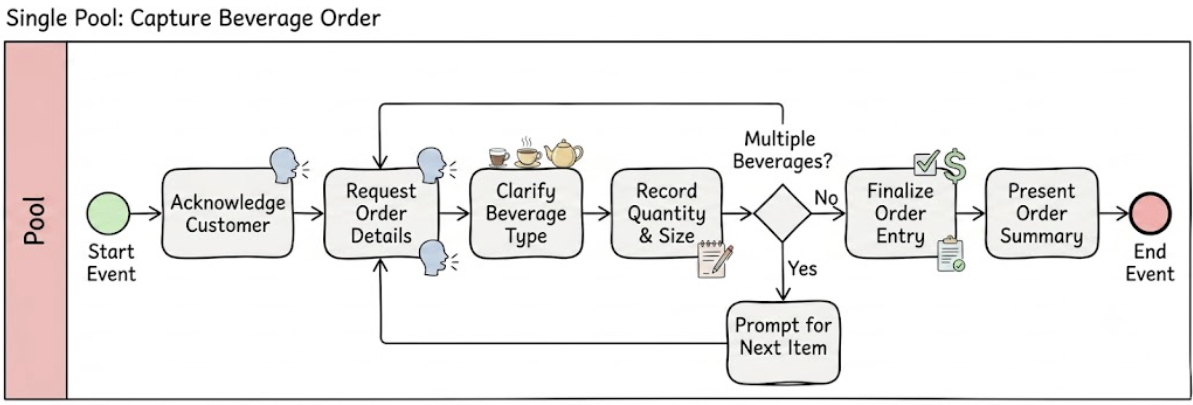
Figure 4: Example Process Diagram for “Capture Beverage Order”
4. Case Study: The Boutique Order & Fulfillment Process
To illustrate these concepts, we will model the process of ordering, packaging, and dispatching custom clothing items for an online boutique.
4.1 Scope and Processes
The scope includes:
-
Receiving and verifying customer orders.
-
Fulfilling and packaging items (Garments/Accessories).
-
Handling restocks for out-of-stock items.
The identified processes are:
-
Fulfill Boutique Order (High-level Collaboration)
-
Capture Customer Order (Detailed Process)
-
Package Boutique Order (Detailed Process)
-
Restock Inventory Item (Detailed Process)
4.2 Step 1: The Collaboration Diagram
We start with a Collaboration Diagram using a Descriptive Model. This highlights the high-level interactions between the Customer, Warehouse Operations, and Purchasing Department.
Figure: Collaboration Diagram – Fulfill Beverage Order
-
Pools: Customer (Black Box), Warehouse Operations (White Box), Purchasing Department (White Box).
-
Message Flows: Dashed lines show message exchanges between pools (e.g., placing the order, sending confirmations).
-
Sub-Processes: Collapsed sub-processes like “Package Boutique Order” conceal operational complexity at this high level.
4.3 Step 2: Detailed Process Diagrams
Next, we drill down into specific sub-processes using Analytic Models.
Capture Customer Order
This process manages intake, payment processing, and regional tax calculations.
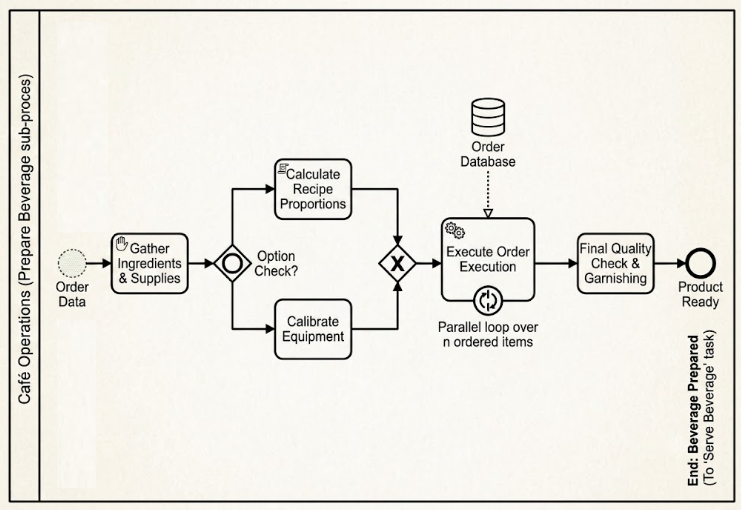
Key Elements:
-
Exclusive Gateways (
[X]): Route logic based on Order Type (Standard vs. Promo) or Payment Method (Credit Card vs. Gift Card). -
Tasks: “Calculate Regional Tax,” “Authorize Credit Card Payment,” “Record Order Details.”
-
End Event: “Order Settled.”
5. Best Practices Applied
-
Naming Conventions:
-
Events: Verb in past tense (
Order Received,Stock Replenished). -
Activities: Verb + Object (
Capture Customer Order,Wrap Gift Box). -
Layout: Strictly left-to-right sequence flow, with vertical message links keeping pool interactions readable.
-
Granularity: Keeps the main Collaboration Diagram clean while delegating rules (like tax/payment branching) to nested Analytic diagrams.
Conclusion
BPMN is a powerful tool that transforms ambiguous business operations into clear, actionable visual models. By starting with a high-level Collaboration Diagram and drilling down into detailed Process Diagrams, organizations can ensure that everyone—from stakeholders to developers—shares a common understanding of how work gets done.
While the BPMN specification is extensive, remember that you only need a core set of symbols to document most processes effectively. Focus on clarity, consistency, and the specific needs of your audience.
Tooling Recommendation
To create professional, compliant, and interactive BPMN diagrams, robust modeling tools are essential. Visual Paradigm is highly recommended for this purpose. It offers a comprehensive suite of features for BPMN 2.0 modeling, including:
-
Intuitive drag-and-drop interface for all BPMN elements.
-
Real-time validation to ensure your diagrams adhere to BPMN standards.
-
Seamless transition from Descriptive to Analytic models.
-
Integration capabilities for generating executable code or documentation.
By leveraging tools like Visual Paradigm alongside the structured approach outlined in this guide, you can elevate your process documentation from simple sketches to strategic assets that drive efficiency and innovation.