


System architecture relies heavily on visual communication. When developers discuss infrastructure, they need a standardized language to describe how software components interact with the physical or virtual environment. The Unified Modeling Language (UML) offers several diagram types, but the UML Deployment Diagram stands out as the definitive tool for mapping the physical execution environment. This guide explores the mechanics, syntax, and strategic application of deployment diagrams for robust system design.
Understanding this diagram type is crucial for bridging the gap between logical design and physical implementation. It answers the question: Where does the code actually run? By visualizing nodes, artifacts, and connections, teams can identify bottlenecks, plan capacity, and ensure security protocols are met before a single line of code is deployed to production.
🔍 What is a Deployment Diagram?
A deployment diagram represents the physical architecture of a system. Unlike class diagrams that focus on structure or sequence diagrams that focus on interaction over time, the deployment diagram focuses on hardware and software topology. It depicts the runtime instances of software components and the hardware resources required to execute them.
- Physical vs. Logical: While it shows hardware, it often abstracts away specific models to focus on function. For instance, a generic server node might represent a specific rack or a cloud instance.
- Execution Environment: It captures the nodes where artifacts are deployed, such as web servers, application servers, and databases.
- Communication: It illustrates how these nodes connect, whether via LAN, WAN, or the internet.
This visualization is essential for DevOps engineers, system architects, and developers. It provides a blueprint for the infrastructure team to provision resources and configure networking.
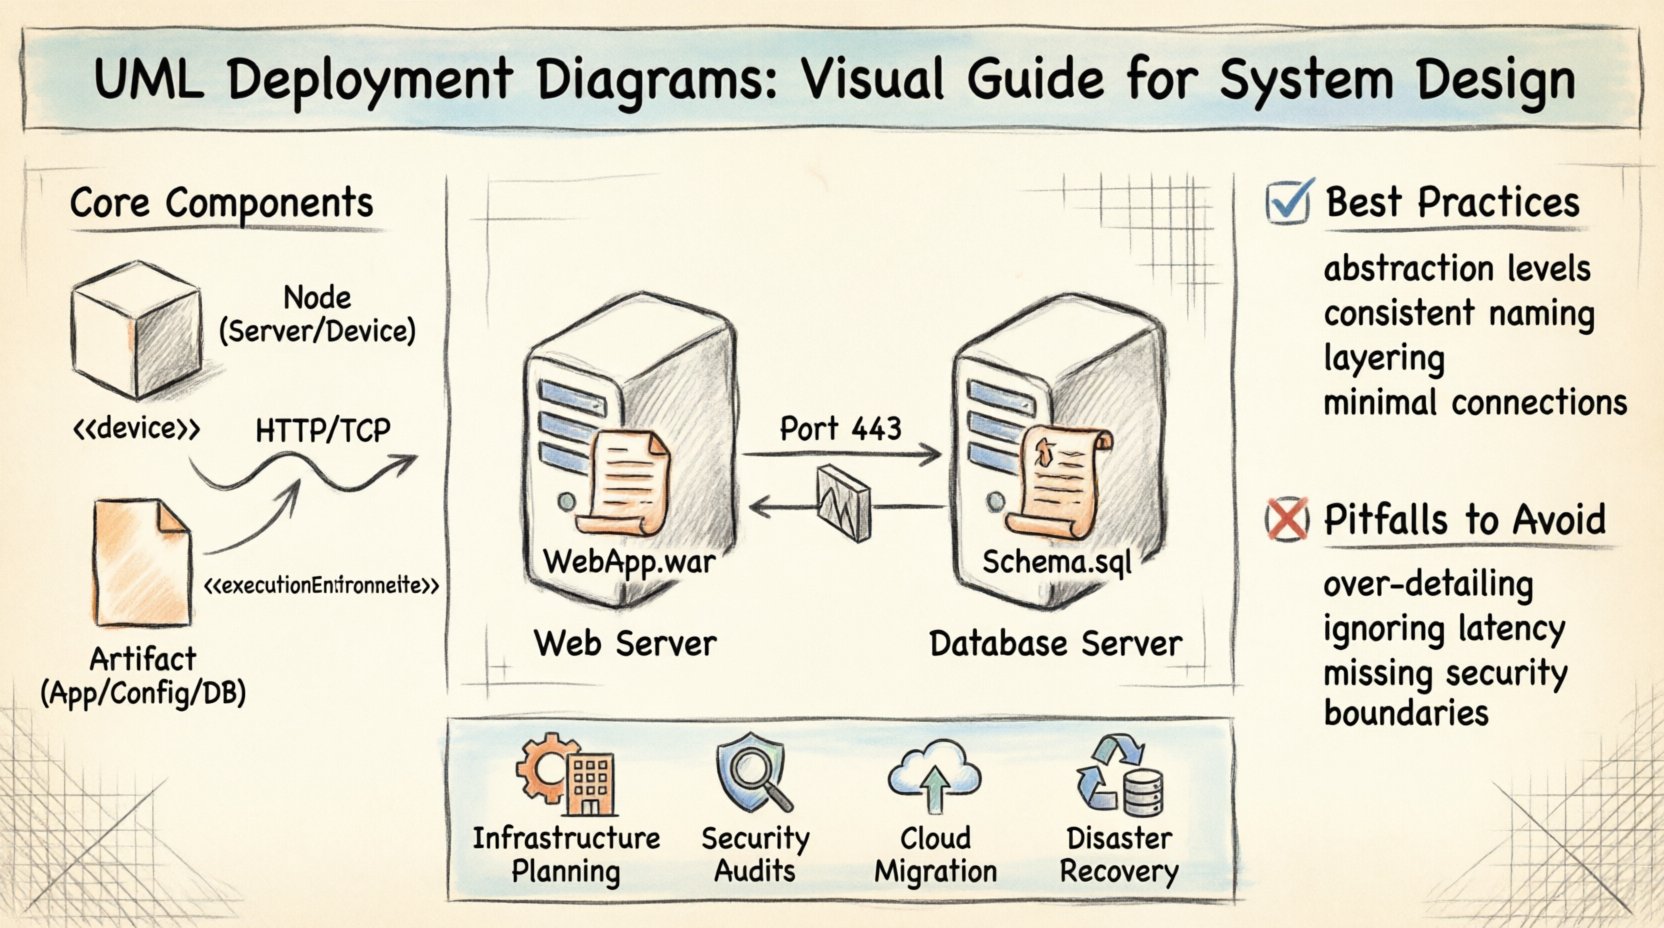
🧩 Core Components and Notation
To read and create these diagrams effectively, one must understand the standard UML notation. The diagram is built from a set of stereotyped elements. Each element carries specific semantic meaning regarding the system’s operation.
1. Nodes
A node is a computational resource. It represents a physical or virtual processing element. In UML notation, a node is drawn as a 3D cube.
- Device Nodes: These represent physical hardware like workstations, routers, or servers. They are typically labeled with a device stereotype.
- Execution Environment: These represent the software layer running on a device, such as an operating system or a runtime container. They define the environment constraints for the artifacts placed inside.
2. Artifacts
Artifacts represent physical pieces of information used or produced by a software system. They are the tangible deliverables.
- Software Artifacts: Executable files, libraries, scripts, or configuration files.
- Database Artifacts: Schemas, stored procedures, or data dumps.
- Documentation: Technical manuals or API specifications that reside on the system.
Artifacts are drawn as a document shape with a folded corner. They are often nested within nodes to show which hardware holds which files.
3. Connections
Connections define the communication paths between nodes. They are not just lines; they represent protocols and media types.
- Communication Paths: These can be physical (cables) or logical (network paths).
- Protocol: The connection often specifies the protocol used, such as HTTP, TCP/IP, or SSH.
📋 Comparison of Deployment Elements
| Element | Visual Shape | Meaning | Example |
|---|---|---|---|
| Node | 3D Cube | Computational Resource | Application Server, Database Server |
| Artifact | Document (Folded) | Software Component | Web App, .dll File, SQL Script |
| Port | Small Rectangle | Interaction Point | API Endpoint, Database Port |
| Interface | Lollipop or Socket | Contract of Service | REST API, JDBC Driver |
| Connector | Line with Label | Communication Path | HTTP Link, Network Cable |
🛠️ Building Blocks: Nodes and Artifacts
Constructing a meaningful diagram requires distinguishing between the container (node) and the content (artifact). Confusing these leads to ambiguity in the design.
Defining Nodes Accurately
A node is not just a server; it is a boundary. It encapsulates the environment. When modeling a microservices architecture, you might see multiple nodes representing different services. Each node should specify the operating system or runtime environment if it affects the deployment.
- Hardware Nodes: Represent physical machines. Essential for on-premise systems.
- Software Nodes: Represent virtual environments. Essential for cloud-native designs where containers or virtual machines are the boundary.
Always label the node clearly. A label like “Web Server” is good, but “Linux Web Server (Port 80)” is better. Specificity aids the infrastructure team in provisioning.
Managing Artifacts
Artifacts are the files that make up the software. In a deployment diagram, you do not list every file. You list the critical deliverables.
- Executable: The main application binary.
- Configuration: Environment-specific settings files.
- Dependencies: Libraries required to run the application.
Grouping artifacts by function helps in understanding the workload. For example, placing all database-related artifacts on the database node clarifies data storage responsibilities.
🔗 Connections and Relationships
The value of a deployment diagram often lies in the connections. These lines show the flow of data and control between the physical components.
Types of Links
- Association: A simple line indicating a relationship. Used for logical connections.
- Dependency: Indicates that one node relies on another. Often used for database access.
- Communication: Explicitly defines the protocol. Crucial for security and performance analysis.
Interfaces and Ports
Complex systems require defined entry points. Ports and interfaces allow nodes to expose functionality.
- Ports: Represent a specific point of interaction on a node. For example, port 443 for HTTPS.
- Interfaces: Define the contract. A node might require an interface to function (e.g., a file system interface) or provide an interface for others to use (e.g., an API).
Using lollipop notation for provided interfaces and socket notation for required interfaces helps readers understand data flow direction without reading labels.
📋 When to Use Deployment Diagrams
Not every design phase requires a deployment diagram. Use it when the physical topology matters.
- Infrastructure Planning: Before provisioning servers, map out the requirements.
- Security Audits: Identify how data moves between nodes to ensure encryption and firewall rules are applied.
- Migration Projects: Visualize the move from on-premise to cloud environments.
- Disaster Recovery: Understand redundancy and failover paths between nodes.
- Capacity Planning: Estimate resource needs based on the number of nodes and connections.
📐 Best Practices for Clear Architecture
A messy diagram confuses stakeholders. Adhere to these principles to maintain clarity.
- Abstraction Levels: Do not mix high-level infrastructure with low-level file details. Keep the diagram focused on the system level, not the file system level.
- Consistent Naming: Use standard naming conventions for nodes and artifacts. Avoid abbreviations that are not industry standard.
- Grouping: Use frames or compartments to group related nodes. For example, a “Frontend Zone” and a “Backend Zone”.
- Minimal Connections: Avoid crossed lines. Arrange nodes logically to minimize visual clutter.
- Layering: Arrange nodes in layers (Presentation, Business Logic, Data) to reflect the logical flow visually.
🚫 Common Pitfalls to Avoid
Even experienced architects make mistakes. Be aware of these common errors.
- Over-detailing: Listing every single .jar or .exe file makes the diagram unreadable. Focus on the major components.
- Ignoring Network Latency: Drawing lines without considering physical distance can lead to performance issues. Indicate network types (LAN vs WAN).
- Missing Security Boundaries: Failing to show firewalls or DMZs can hide security risks. Explicitly mark network boundaries.
- Static vs. Dynamic: Deployment diagrams are static. Do not try to show runtime state changes like scaling events unless using specific extension stereotypes.
- Ignoring Hardware Constraints: Failing to note disk space or memory requirements on nodes can lead to deployment failures.
🔄 Relationship with Other UML Diagrams
The deployment diagram does not exist in isolation. It integrates with other diagrams to form a complete system model.
Class Diagrams
Class diagrams define the code structure. Deployment diagrams show where the compiled code lives. A class diagram might define a “User” class, while the deployment diagram shows where the “User Service” application runs.
Sequence Diagrams
Sequence diagrams show the flow of messages. Deployment diagrams show the infrastructure supporting those messages. You can trace a sequence of calls in a sequence diagram back to the specific nodes in the deployment diagram that handle them.
Component Diagrams
>Component diagrams define logical modules. Deployment diagrams map these modules to physical nodes. A component diagram might show an “Authentication Module,” while the deployment diagram shows it deployed on a specific load-balanced node.
🚀 Steps to Create Your First Diagram
Follow this workflow to ensure a structured design process.
- Identify Hardware: List all physical or virtual devices involved in the system.
- Identify Software: List the applications, databases, and services to be deployed.
- Map Relationships: Draw lines connecting devices to the software they host.
- Define Interfaces: Specify how the nodes talk to each other (ports, protocols).
- Review Constraints: Add notes about security, performance, or capacity limits.
- Validate: Check if all requirements from the system design are met.
🌐 Modeling Cloud and Hybrid Infrastructure
Modern systems often span multiple environments. Cloud computing introduces virtual nodes that behave differently than physical ones.
- Virtualization: A single physical server might host multiple virtual machines. Use nested nodes to represent this hierarchy.
- Load Balancers: Crucial in cloud designs. Represent them as nodes that distribute traffic to backend servers.
- Regions and Availability Zones: If deploying globally, indicate geographical separation. This is vital for latency and compliance.
- Managed Services: Some components are managed by a provider. Represent these clearly to distinguish between self-managed and managed infrastructure.
🛡️ Security Considerations in Design
Security is a first-class citizen in deployment design. The diagram should reflect security zones.
- DMZ (Demilitarized Zone): Show public-facing nodes separately from internal nodes.
- Firewalls: Use specific shapes or labels to denote firewalls between network segments.
- Encryption: Indicate where data is encrypted in transit (on the connection lines) and at rest (on the storage nodes).
- Authentication Points: Mark nodes that handle identity management and key distribution.
📈 Scaling and Resilience
A good deployment diagram anticipates growth. It is not just a snapshot of the current state but a plan for the future.
- Redundancy: Show multiple nodes for critical services. If one fails, the other takes over.
- Horizontal Scaling: Indicate that multiple instances of a node can exist.
- Failover Paths: Draw backup connections to show how the system survives network failures.
- Monitoring: Include nodes dedicated to logging and monitoring to ensure visibility.
🔍 Analyzing the Diagram for Gaps
Once the diagram is complete, perform a gap analysis.
- Single Points of Failure: Are there any nodes with no backup?
- Unnecessary Complexity: Can any connections be simplified?
- Missing Dependencies: Are there components required that are not shown?
- Compliance: Does the physical layout meet data sovereignty laws?
This review ensures the design is robust before implementation begins. It shifts the focus from “does it work” to “does it work reliably under load.”
🏁 Final Thoughts on System Modeling
Deployment diagrams are a bridge between code and reality. They transform abstract requirements into concrete infrastructure plans. By mastering this notation, developers gain the ability to communicate complex architectural decisions clearly.
Remember that diagrams are living documents. As the system evolves, the deployment map must change. Keep them updated to maintain an accurate understanding of the system state. This practice reduces technical debt and simplifies troubleshooting when issues arise in production.
Focus on clarity, accuracy, and utility. A well-drawn deployment diagram is a tool for success, not just a bureaucratic requirement. It empowers the entire team to see the system as a cohesive whole.

