


In the fast-paced world of software development, documentation often gets relegated to the back burner. It is easy to assume that if the code works, the system works. However, when infrastructure becomes complex, visual representations of how software actually runs become critical. A deployment diagram is not just a drawing for the architecture team; it is a communication tool that stabilizes the entire development lifecycle. 👇
Many developers, project managers, and operations engineers skip creating or maintaining these diagrams because they feel it is “too much overhead.” They believe their mental model of the system is sufficient. In small projects, this might hold true. But as the application scales, the mental model breaks. Without a shared visual reference, misunderstandings lead to production incidents, extended downtime, and frustrated teams. 🚨
This guide explores why deployment diagrams are essential for every member of a technical team. We will move beyond the abstract definition and look at how these diagrams impact daily work, incident response, and long-term system health. Whether you are writing code, managing a backlog, or configuring servers, understanding the deployment landscape is a core competency for modern software delivery. 🚀
What Exactly Is a Deployment Diagram? 📐
A deployment diagram is a visual representation of the physical architecture of a system. Unlike a class diagram that shows code structure, or a sequence diagram that shows interactions over time, a deployment diagram maps out the hardware and software environment where the application actually executes. 💻
It illustrates the relationship between the software components and the physical hardware nodes that host them. This includes servers, databases, network devices, and the connections between them. It answers the fundamental question: “Where does this code live, and how does it talk to other parts of the system?” 🌐
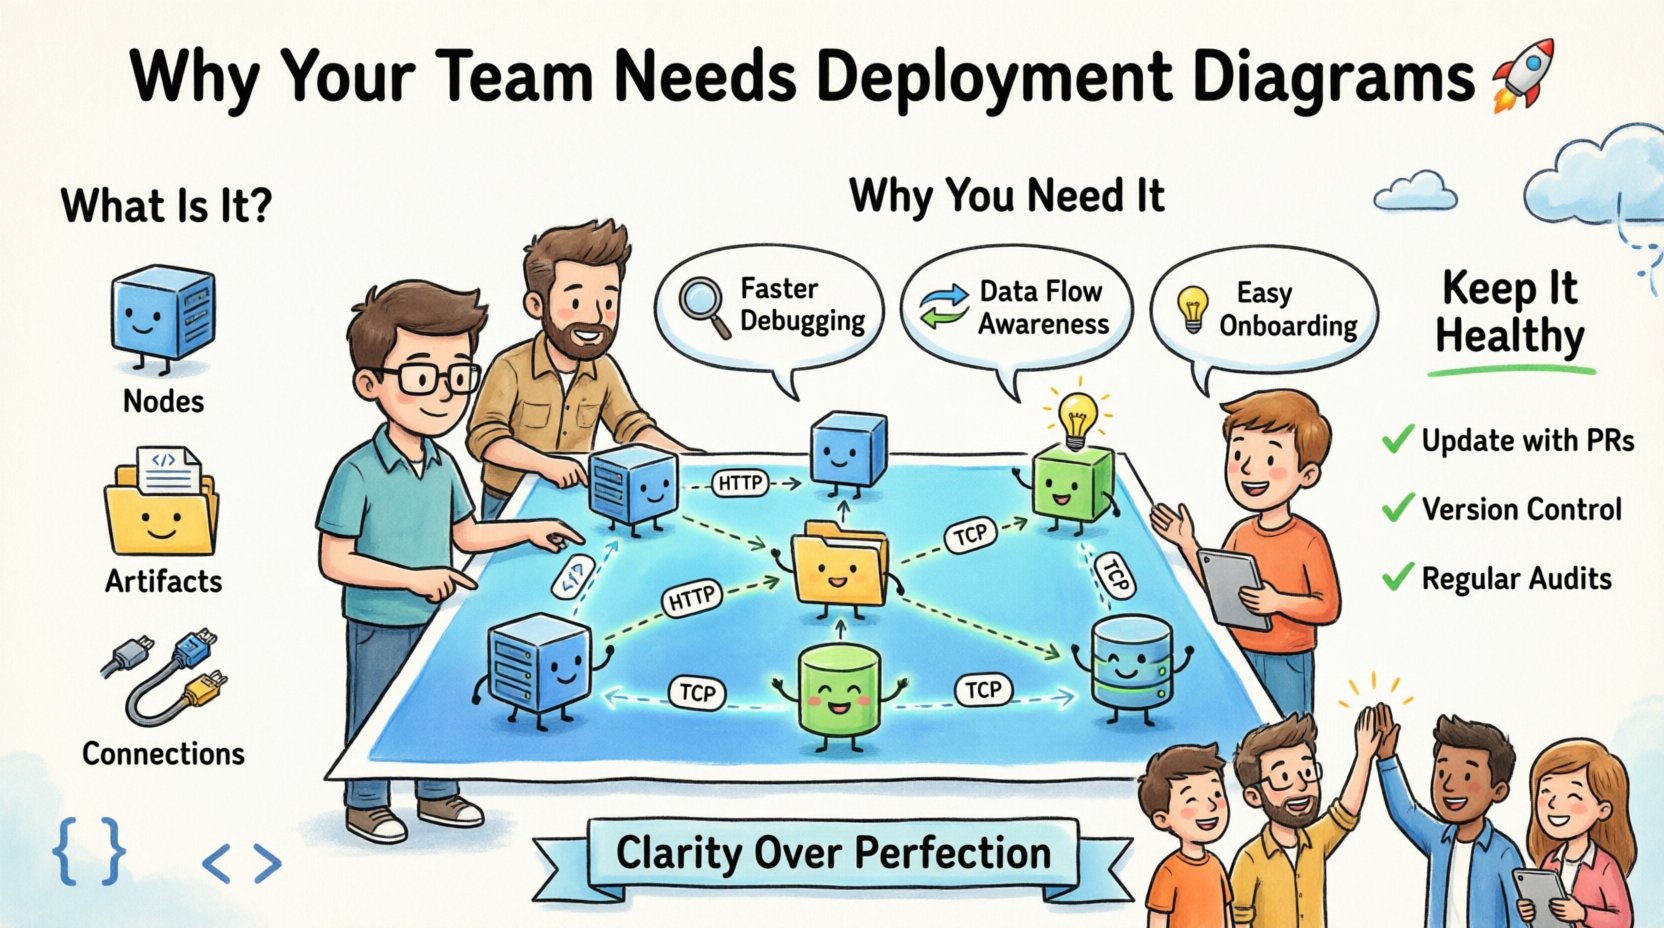
At its core, a deployment diagram consists of three main elements:
- Nodes: These represent the physical or virtual computing resources. Examples include application servers, database servers, load balancers, and client devices like desktops or mobile phones.
- Artifacts: These are the software components deployed onto the nodes. This could be executable files, libraries, configuration files, or database schemas.
- Connections: These show the communication paths between nodes and artifacts. They indicate the protocols used, such as HTTP, TCP/IP, or database queries.
While the syntax might vary slightly depending on the modeling standard used, the underlying purpose remains consistent: clarity. It transforms abstract infrastructure concepts into a concrete map that anyone on the team can read. 👁️
Why Developers Need Them Beyond the Architecture Team 👨💻
It is a common misconception that deployment diagrams are solely the responsibility of architects. While architects design them, the entire development team relies on them. Here is why a developer should care about the physical layout of the system. 🛠️
1. Debugging and Incident Response
When a system fails in production, the first question is usually “Where did it fail?” Without a deployment diagram, engineers might spend valuable time guessing which server is hosting the service or which database connection is causing the bottleneck. 🚧
- Faster Triage: A diagram allows you to instantly identify dependencies. If the authentication service is down, you can see which downstream services depend on it.
- Network Context: You can see if a service is in a private subnet or exposed publicly. This helps in understanding firewall rules or security group configurations without asking the operations team.
- Scope Isolation: You can identify which part of the infrastructure is affected by a change. If you are updating a library, you know exactly which deployment nodes need to be patched.
2. Understanding Data Flow
Code does not exist in a vacuum. It interacts with databases, caches, and message queues. A deployment diagram visualizes where these data stores reside. 💾
- Latency Awareness: You can see if a database is co-located with the application or in a different region. This informs your caching strategies.
- Security Boundaries: It highlights where sensitive data is stored and how it is accessed. This ensures you do not accidentally expose data during development.
- Load Distribution: You can understand how traffic is routed. Is it round-robin? Is there a dedicated queue? This affects how you write your code to handle failures.
3. Onboarding New Team Members
When a new engineer joins the team, they often struggle to understand the ecosystem. Reading code is one thing; understanding the infrastructure is another. 📝
- Visual Onboarding: A diagram provides an immediate overview of the system topology.
- Reduced Context Switching: New hires do not need to ask basic questions about server names or network paths repeatedly.
- Confidence: Seeing the big picture helps new developers feel more comfortable making changes, knowing where their code fits in the larger puzzle.
Key Components Explained Simply 🔍
To make these diagrams effective, you need to understand the symbols and standards used. While tools exist to automate drawing, understanding the components ensures accuracy. 🔒
Nodes and Cubes
Nodes are typically represented as three-dimensional boxes or cubes. They represent computing resources. 📦
- Computing Nodes: These are servers running the application logic.
- Storage Nodes: These represent database servers or file storage systems.
- Network Nodes: These include routers, firewalls, and load balancers that direct traffic.
Artifacts and Files
Artifacts are the software pieces that sit on the nodes. They are often represented as cylinders or document icons. 📄
- Executable Files: The compiled code or binaries that run on the server.
- Configuration Files: Settings that determine how the application behaves.
- Data Repositories: The actual database schemas or data files stored on the node.
Communication Paths
Lines connect nodes to show how they talk. These lines often have labels indicating the protocol. 📡
- HTTP/HTTPS: Web traffic between clients and servers.
- TCP/IP: General network communication.
- Database Protocols: Specific connections to data stores like SQL or NoSQL.
- Message Queues: Asynchronous communication channels.
Common Pitfalls to Avoid ⚠️
Creating a diagram is not enough; it must be useful. Many teams create diagrams that are either too complex or quickly become outdated. Here are common mistakes to watch out for. 🚫
| Pitfall | Impact | Solution |
|---|---|---|
| Over-Complexity | Too many details make the diagram unreadable and confusing. | Focus on high-level infrastructure. Hide implementation details unless necessary. |
| Outdated Documentation | Team members trust the diagram, but it no longer matches reality. | Update diagrams during the code review process or deployment changes. |
| Too Many Abstractions | Using generic terms that do not reflect the actual environment. | Use specific names for nodes and services that match the configuration. |
| Ignoring Security | Failing to show security boundaries or encryption points. | Include firewalls, gateways, and encryption protocols in the visual map. |
One major issue is treating the diagram as a one-time task. Infrastructure changes frequently. Services are moved, scaled, or replaced. If the diagram does not evolve with the system, it becomes noise rather than signal. 📈
Maintaining Documentation Health 🤝
How do you ensure the diagram stays accurate without creating a massive workload? The key is integration into existing workflows. 🔄
1. Integrate with Pull Requests
If a change affects the deployment structure, it should be flagged. When a developer modifies a configuration file or adds a new service, the deployment diagram should be updated as part of the pull request. 👁️
- This ensures the diagram is reviewed by peers alongside the code.
- It prevents “documentation drift” where the map diverges from the codebase.
- It encourages a culture where documentation is part of the definition of done.
2. Version Control for Diagrams
Treat diagram files like code. Store them in the same repository as the application code. 📁
- Use version control to track changes over time.
- Allow teams to revert to previous versions if a change breaks the system.
- Ensure the diagram file is text-based if possible, making diffs readable.
3. Regular Audits
Schedule periodic reviews of the architecture. 🔍
- Quarterly reviews can catch drift that daily updates miss.
- Use these audits to identify technical debt in the infrastructure itself.
- Encourage feedback from the operations team on the accuracy of the map.
The Impact on DevOps and CI/CD 🛠️
DevOps relies heavily on automation. Deployment diagrams feed into this automation. They define the target state of the infrastructure. 🚀
1. Infrastructure as Code (IaC)
Many teams use IaC to manage servers. The deployment diagram serves as the visual counterpart to the code that provisions these servers. 💾
- It helps verify that the IaC templates match the intended architecture.
- It aids in troubleshooting failed deployments by showing the expected topology.
- It ensures that new environments (staging, production) are identical.
2. Pipeline Visibility
Continuous Integration and Continuous Deployment pipelines move code from one stage to another. The deployment diagram shows where these stages land. 🔄
- It clarifies which environment is being tested.
- It helps in setting up proper security roles for the pipeline.
- It provides context for why a deployment might be blocked (e.g., missing dependency).
3. Disaster Recovery Planning
When planning for failures, you need to know what to rebuild. 🚨
- A diagram helps identify critical dependencies that must be restored first.
- It highlights single points of failure in the infrastructure.
- It aids in calculating Recovery Time Objectives (RTO) for different components.
Real-World Scenarios: When You Need a Diagram Most 🌍
There are specific moments in the software lifecycle where a deployment diagram is not just helpful; it is necessary. 📝
Scenario 1: Onboarding a New Engineer
A new developer joins a complex microservices environment. They need to understand how their service talks to others. 👤
- Without Diagram: They spend weeks asking questions and reading logs.
- With Diagram: They see the service dependencies and network paths immediately.
- Result: Faster time to productivity and fewer mistakes.
Scenario 2: Production Incident
A service is slow. The team needs to know if it is the database or the network. 🚧
- Without Diagram: Engineers guess which node is the database.
- With Diagram: They see the database connection path and check the specific server.
- Result: Faster resolution time and reduced downtime.
Scenario 3: Security Audit
An external auditor needs to verify data protection. 🔒
- Without Diagram: They must inspect every server manually.
- With Diagram: They can see the security boundaries and encryption points visually.
- Result: Faster audit completion and higher confidence in security posture.
Scenario 4: Cost Optimization
The company wants to reduce infrastructure costs. 💰
- Without Diagram: It is hard to see which servers are idle or underutilized.
- With Diagram: You can map services to their specific hardware and identify consolidation opportunities.
- Result: Targeted cost savings without impacting performance.
Checklist for Effective Diagrams ✅
To ensure your deployment diagrams add value, use this checklist before sharing them with the team. 📝
- Clarity: Is the diagram easy to understand at a glance? Are labels clear?
- Accuracy: Does the diagram match the current running system?
- Completeness: Are all critical nodes and connections included? Is nothing missing?
- Consistency: Are the symbols and notations consistent with team standards?
- Accessibility: Is the diagram stored where everyone can access it?
- Security: Does it show sensitive areas without exposing secrets?
- Versioning: Is there a version number or date on the diagram?
- Maintainability: Is it easy to update when the system changes?
The Human Element of Architecture 🤝
Ultimately, deployment diagrams are about people. They bridge the gap between technical design and human understanding. 👥
When a team shares a visual map, they share a common language. This reduces friction. It reduces the need for repetitive meetings. It reduces the anxiety of change. 👋
Even if you are not the architect, taking ownership of your part of the diagram fosters a sense of responsibility. It encourages you to think about the system as a whole, not just your code. This holistic view is what separates junior engineers from senior engineers. 🎓
By maintaining these diagrams, you contribute to the stability and longevity of the software. You are building a legacy of knowledge that outlasts any single release. 👇
Final Thoughts on Infrastructure Visibility 🔍
The complexity of modern software systems demands better visibility. Deployment diagrams provide that visibility without requiring deep knowledge of every line of code. 👨💻
They are a practical tool for communication, a safety net for operations, and a foundation for growth. Investing time in creating and maintaining them pays dividends in reduced incidents, faster onboarding, and clearer decision-making. 📈
Start small. Draw the current state. Identify the gaps. Update it as you go. Over time, this practice becomes second nature. The goal is not perfection; it is clarity. 🎯
Whether you are a developer, a project manager, or an operations specialist, understanding where your software lives is a critical skill. It empowers you to make better decisions and build more robust systems. 🛡️
So, pick up your pen or open your modeling tool. Draw the map. Share it with your team. And watch as the chaos of infrastructure begins to take shape. 🏗️

