


In the landscape of software architecture, understanding how systems physically operate is just as critical as understanding their logical structure. The UML Deployment Diagram serves as the bridge between abstract design and concrete infrastructure. It maps the physical architecture, detailing the hardware, networks, and software components that make up the runtime environment. For developers and architects, this diagram is not merely a drawing; it is a blueprint for stability, scalability, and security. 📈
Creating an accurate model requires precision. A vague diagram leads to deployment errors, security gaps, and maintenance nightmares. This guide provides a structured approach to modeling deployment environments. It focuses on the essential elements, relationships, and a rigorous checklist to ensure your architectural documentation reflects reality.
Understanding the Foundation 🧩
Before diving into the checklist, it is vital to grasp what constitutes a Deployment Diagram. Unlike Class Diagrams which focus on data structure, or Sequence Diagrams which focus on behavior, the Deployment Diagram focuses on physical execution. It answers the question: “Where does the software run?”
This type of diagram is particularly useful during the deployment phase of the software development lifecycle. It helps DevOps teams, system administrators, and developers align on the infrastructure requirements. It visualizes:
- The physical topology of the network.
- The hardware resources available (servers, databases, gateways).
- The software artifacts deployed on those resources.
- The communication paths between components.
Core Elements Breakdown 📦
Accuracy begins with correct terminology. Every element in the diagram has a specific meaning. Mislabeling an artifact or a node can lead to configuration errors in the production environment.
| Element | Definition | Visual Representation |
|---|---|---|
| Node | A physical computing resource. It can be hardware (server, router) or a software runtime environment (container, OS). | 3D Cube shape |
| Artifact | A physical representation of a software component. This includes executable files, libraries, databases, or configuration files. | Document shape |
| Communication Path | The link between nodes. It defines the protocol and bandwidth required for data exchange. | Line (Solid or Dashed) |
| Device | Typically represents a physical device like a computer, router, or mobile phone. | Device Icon |
| Execution Environment | A software platform that hosts the artifacts, such as a Java Virtual Machine or a Web Server. | Box inside a Node |
Understanding these distinctions prevents the common mistake of treating a software container as a physical server. Both are nodes, but they function differently within the hierarchy.
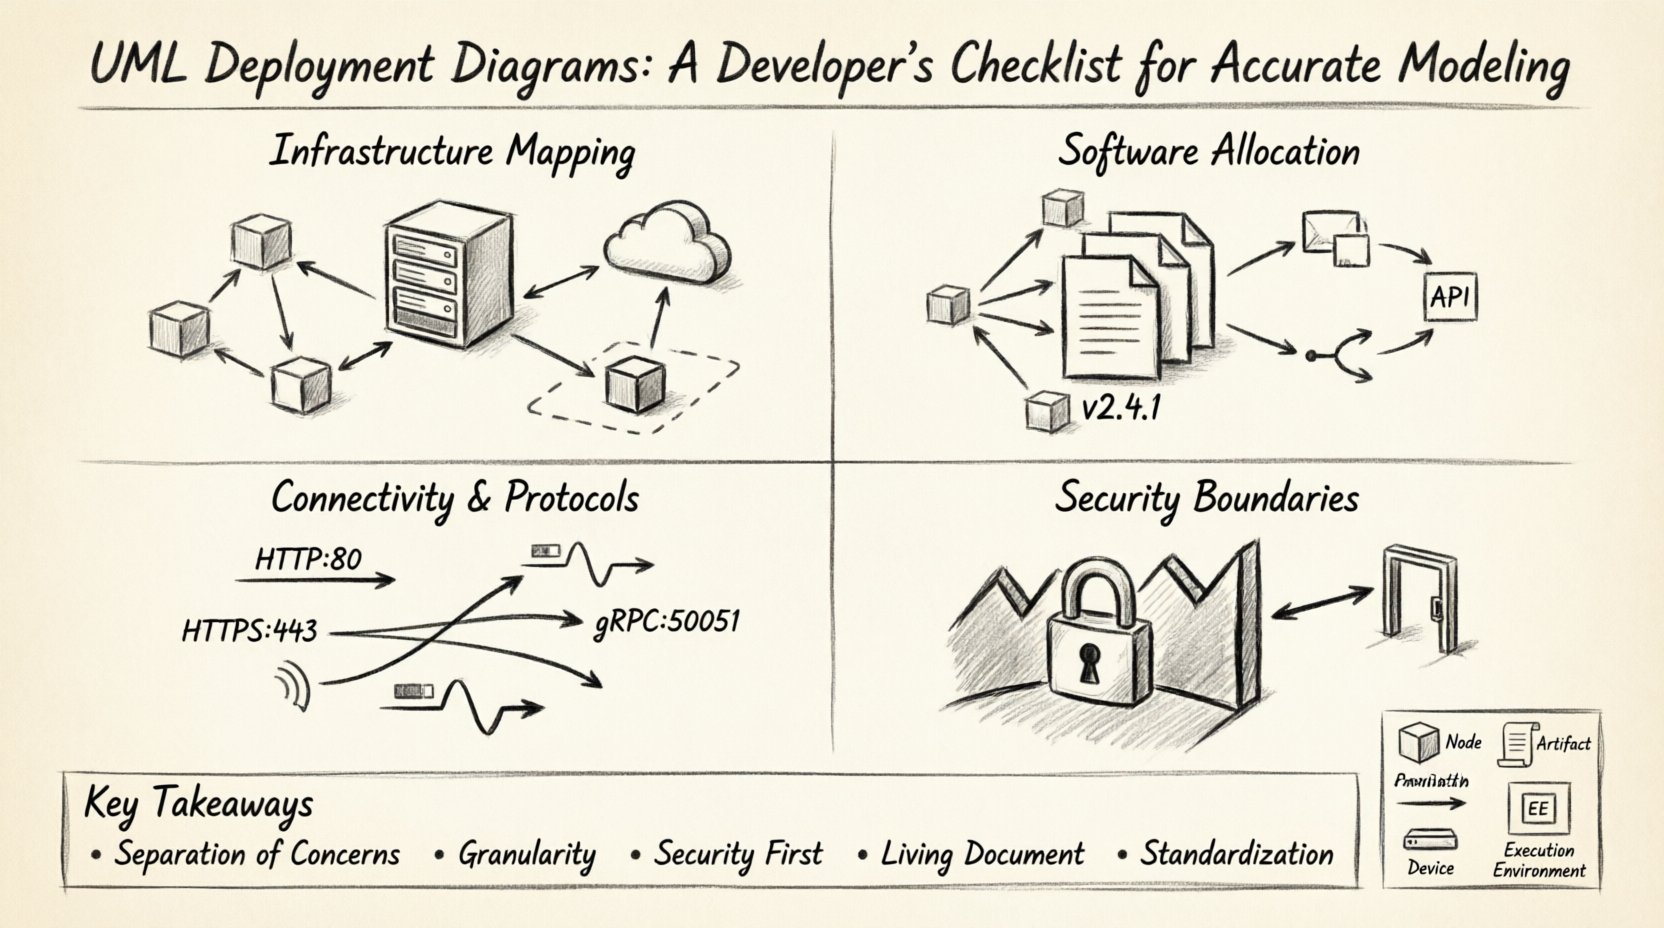
The Architectural Verification Checklist ✅
To ensure your model is production-ready, you must validate it against a set of rigorous criteria. This checklist is designed to be used during the design review phase. It covers infrastructure, software allocation, connectivity, and security.
1. Infrastructure Mapping 🏗️
The first step is to accurately represent the physical or virtual infrastructure. Do not assume that the diagram matches the code; verify it against the actual infrastructure-as-code definitions.
- Identify All Nodes: List every server, database instance, and gateway. Are there edge devices or IoT sensors involved?
- Distinguish Physical vs. Virtual: Clearly mark virtual machines, containers, or bare-metal servers. This distinction impacts resource planning.
- Label Hardware Specs: Include CPU, memory, and storage requirements on high-level nodes. This helps capacity planning.
- Network Segments: Define the network boundaries. Are nodes in a DMZ, a private subnet, or a public cloud region?
- Redundancy: Does the diagram show failover nodes? A single point of failure in the diagram should be flagged as a risk.
2. Software Allocation 👨💻
Once the hardware is defined, the software must be placed correctly. This section ensures that the code runs where it is intended.
- Map Artifacts to Nodes: Every executable file, script, or library should be attached to a specific node. Avoid floating artifacts.
- Execution Environments: Ensure the node supports the artifact. If a Node is labeled as a Linux Server, verify the Artifact does not require Windows specifically.
- Version Control: Note the version of the software running on each node. Different nodes might run different versions during a migration phase.
- Middleware: Identify any middleware required, such as message queues, caching layers, or API gateways. These are critical artifacts.
- Configuration Files: Do not ignore configuration artifacts. Environment-specific settings (dev, staging, prod) should be visible or referenced.
3. Connectivity and Protocols 🔄
Communication is the lifeblood of a distributed system. The lines connecting your nodes carry more than just data; they carry security implications and performance constraints.
- Specify Protocols: Don’t just draw a line. Label it. Is it HTTP, HTTPS, gRPC, AMQP, or TCP? The protocol dictates the security and performance.
- Port Numbers: For critical infrastructure, note the port numbers. This aids firewall configuration.
- Directionality: Use arrows to indicate the flow of data. Is the database read-only for this node? Is the client pushing data to the server?
- Bandwidth: For high-traffic systems, annotate the required bandwidth. This prevents network bottlenecks.
- Latency Constraints: If real-time processing is required, note the latency expectations between nodes.
4. Security Boundaries 🔒
Security should be modeled visually. A deployment diagram that ignores security zones is incomplete.
- Firewalls: Draw firewalls between trusted and untrusted networks. Show where traffic is inspected.
- Encryption Zones: Highlight areas where data must be encrypted at rest or in transit.
- Authentication Points: Where does authentication happen? Is it at the gateway, the application, or the database?
- Access Control: Note which nodes have access to sensitive data nodes. Not every web server should talk directly to the core database.
- Compliance: If regulations require data to stay within a specific region, mark that region on the diagram.
Managing Complexity 🧱
As systems grow, deployment diagrams can become overwhelming. A single diagram showing every microservice, database, and load balancer across a global infrastructure is unreadable. You must manage complexity through abstraction.
1. Hierarchical Modeling
Use a layered approach. Start with a high-level view showing the major regions and critical paths. Then, create sub-diagrams for specific clusters or services. This keeps the main diagram clean while retaining detail where needed.
- Global View: Show data centers, cloud regions, and major gateways.
- Cluster View: Zoom in on a specific Kubernetes cluster or server farm.
- Service View: Drill down into a specific microservice deployment.
2. Aggregation
Group similar nodes together. If you have 50 identical web servers, do not draw 50 separate nodes. Draw one node labeled “Web Server Cluster (50 instances)”. This reduces visual noise while maintaining accuracy regarding capacity.
3. Standardization
Establish a naming convention for all nodes and artifacts. Use prefixes like “DB-“, “APP-“, or “GW-“. Consistency reduces cognitive load when reading the diagram. Avoid ambiguous names like “Server1” or “MainBox”.
Common Modeling Mistakes ⛔
Even experienced architects make errors. Recognizing these pitfalls early saves significant time during implementation.
- Mixing Logical and Physical: Do not put software classes on a deployment node. Keep the Class Diagram separate. The Deployment Diagram is about files and machines, not objects and methods.
- Ignoring Network Latency: Assuming all nodes are connected via a local LAN. In cloud environments, nodes in different regions have significant latency.
- Overlooking Dependencies: Forgetting to model dependencies between artifacts. If Artifact A needs Artifact B to start, that relationship should be clear.
- Static State: Treating the diagram as a one-time drawing. Systems evolve. A diagram that is not updated becomes misleading.
- Missing External Interfaces: Forgetting third-party services. If your app calls an external payment gateway, that external node must be represented.
Integration with Other Models 🤖
A deployment diagram does not exist in isolation. It interacts with other UML diagrams to provide a complete picture of the system.
1. With Class Diagrams
The Class Diagram defines the internal structure of the software. The Deployment Diagram defines where that software lives. Ensure that the components in the Class Diagram are represented as Artifacts in the Deployment Diagram. This traceability ensures the code matches the infrastructure plan.
2. With Sequence Diagrams
Sequence Diagrams show the flow of messages. The Deployment Diagram provides the context for those messages. If a Sequence Diagram shows a message from “Client” to “Server”, the Deployment Diagram must show the physical path that message travels.
3. With Activity Diagrams
Activity Diagrams show the workflow. The Deployment Diagram shows the resources required to execute that workflow. For example, if an Activity Diagram shows a “Process Image” step, the Deployment Diagram should show the GPU or compute node capable of that task.
Maintenance and Evolution 🔄
Software is never static. As requirements change, the infrastructure changes. The deployment diagram must evolve alongside the codebase.
- Versioning: Treat the diagram like code. Store it in a version control system. This allows you to revert to previous states if a deployment fails.
- Automated Updates: Where possible, generate the diagram from infrastructure code. Tools can parse Terraform or CloudFormation templates to update the diagram automatically.
- Review Cycles: Include diagram updates in the code review process. If the infrastructure changes, the diagram must be updated before the merge.
- Documentation Links: Link the diagram to operational runbooks. If a node is marked as “Critical”, link it to the disaster recovery plan.
- Stakeholder Alignment: Regularly review the diagram with operations teams. They know the infrastructure better than developers. Their feedback ensures the model remains accurate.
Conclusion 🏁
Building a UML Deployment Diagram is an exercise in clarity and precision. It requires a deep understanding of both the software being built and the environment in which it will run. By following a structured checklist, avoiding common pitfalls, and maintaining the model over time, you create a valuable asset for your team.
This diagram serves as the single source of truth for infrastructure. It reduces ambiguity between development and operations. It prevents configuration drift. And ultimately, it ensures that the system you build functions reliably in the real world. Invest the time in modeling accurately, and the deployment process will become smoother and more predictable.
Remember, the goal is not just to draw a picture. The goal is to communicate the physical reality of your system. Use the checklist provided here to validate your work. Ensure every node, artifact, and connection is accounted for. With a solid deployment model, you lay the groundwork for a resilient and scalable architecture.
Key Takeaways 👏
- Separation of Concerns: Keep logical design separate from physical deployment.
- Granularity: Use hierarchy to manage complexity without losing detail.
- Security First: Always model boundaries and encryption zones.
- Living Document: Update the diagram whenever infrastructure changes.
- Standardization: Use consistent naming and symbols for clarity.

