


In the intricate landscape of modern software engineering, the separation between code and infrastructure has blurred. Full-stack developers are no longer writing logic in isolation; they are designing ecosystems. Within this ecosystem, a deployment diagram serves as the blueprint for reality. It translates abstract code into tangible infrastructure, defining where software lives, how it communicates, and how it survives. While often overlooked in favor of sequence or component diagrams, deployment diagrams provide the critical context required for stability and scalability.
Understanding the physical and logical topology of an application is not merely a documentation exercise. It is a fundamental requirement for effective troubleshooting, security auditing, and capacity planning. This guide explores the structural necessity of deployment diagrams, moving beyond basic definitions to examine how they function as operational assets within a full-stack environment.
🧩 Defining the Deployment Diagram in Context
A deployment diagram is a visual representation of the physical architecture of a software system. It maps software artifacts to hardware nodes. Unlike a class diagram, which focuses on internal object structures, or a sequence diagram, which focuses on temporal interaction, a deployment diagram focuses on location and connectivity.
In a full-stack setting, this distinction is vital. The frontend, the backend API, the database, and the caching layers often reside on different machines or within different logical boundaries. The deployment diagram illustrates these boundaries.
Core Elements of the Diagram
To understand the utility of these diagrams, one must first identify the standard components used to construct them:
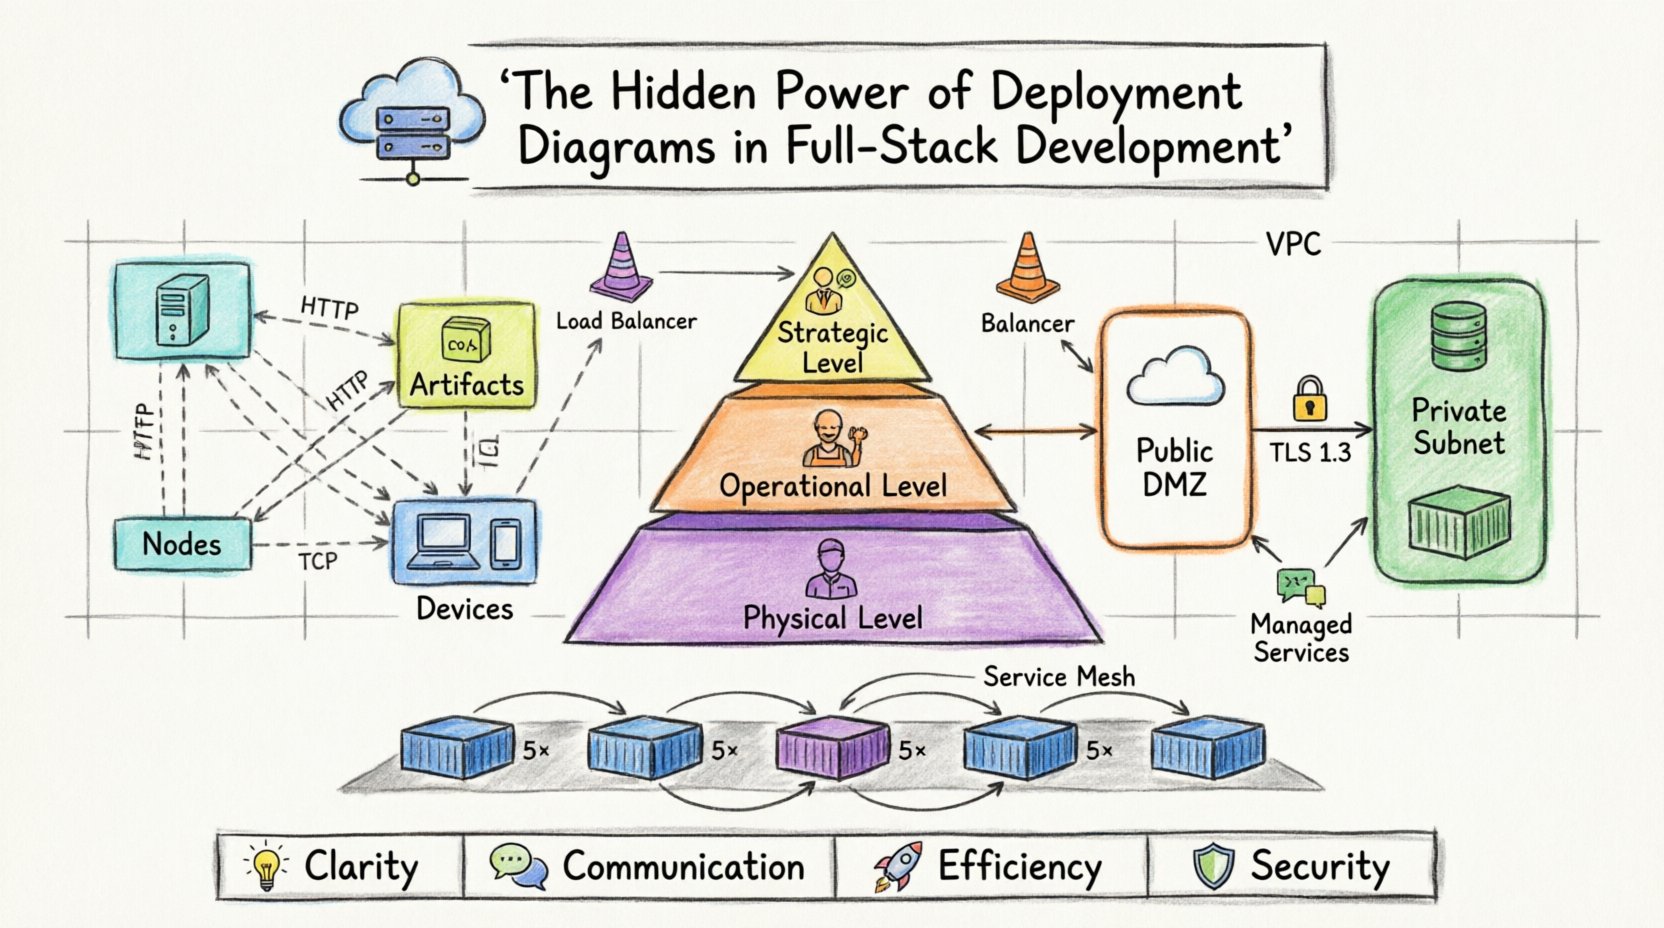
- Nodes: Representing physical computing resources. These can be servers, devices, or execution environments. A node is the container for artifacts.
- Artifacts: The software components being deployed. This includes executables, libraries, database schemas, or container images.
- Connections: The communication channels between nodes. These represent network protocols, such as HTTP, TCP/IP, or database drivers.
- Devices: End-user hardware, such as workstations, mobile phones, or tablets, often included to show the entry point into the system.
By mapping these elements, teams gain a spatial understanding of the application. This spatial understanding is the difference between guessing where a failure might occur and diagnosing it systematically.
🌐 Why Full-Stack Teams Require This Visualization
Full-stack development implies ownership of the entire stack, from the client interface to the data persistence layer. This ownership creates a high risk of architectural drift. Without a deployment diagram, the mental model of the infrastructure held by different team members may diverge. One engineer might assume the database is on the same host as the application server, while another assumes it is on a separate cluster.
Scenarios Where the Diagram Adds Value
- Onboarding New Engineers: New team members can grasp the system topology immediately without digging through configuration files or cloud console settings.
- Capacity Planning: Visualizing resource allocation helps identify bottlenecks. If a single node handles all traffic for a specific service, the diagram highlights this single point of failure.
- Security Audits: Diagrams clarify network zones. They show where sensitive data resides and how it is accessed from external environments.
- Migration Planning: When moving from on-premise to cloud infrastructure, or between cloud providers, the diagram serves as the target state specification.
🗺️ Mapping Infrastructure Topology
The most common error in creating deployment diagrams is attempting to draw every single server in existence. This leads to clutter and reduces readability. Instead, diagrams should focus on logical groupings and functional boundaries.
Abstraction Levels
Different stakeholders require different levels of detail. A CTO needs to see high-level cost and location distribution. A DevOps engineer needs to see network ports and service instances. A deployment strategy should account for these layers.
| Diagram Level | Target Audience | Detail Granularity | Primary Focus |
|---|---|---|---|
| Strategic | Management, Architects | High | Cost, Regions, High Availability |
| Operational | DevOps, SREs | Medium | Service instances, Load Balancers, Protocols |
| Physical | Infrastructure Engineers | Low | IP Addresses, Hardware Specs, Rack Locations |
Using these levels prevents information overload. The Operational level is typically the sweet spot for full-stack development, balancing technical detail with strategic overview.
Representing Cloud Infrastructure
Modern development rarely involves bare metal servers. Most systems run on cloud infrastructure. When drawing deployment diagrams for cloud environments, it is crucial to represent logical groupings rather than specific instance IDs.
- Virtual Private Clouds (VPCs): Represented as large containers enclosing internal resources.
- Load Balancers: Crucial for distributing traffic. These should be clearly marked as entry points.
- Managed Services: Databases, queues, and storage buckets often exist outside the application nodes. They should be drawn as external nodes connected via specific protocols.
🔒 Visualizing Data Flow and Security
A deployment diagram is not just about where software lives; it is about how data moves between those locations. In a full-stack application, data flows from the client, through the network, to the backend, and finally to storage. Visualizing this flow is essential for security compliance.
Defining Trust Boundaries
Security relies on trust boundaries. A deployment diagram makes these boundaries visible. For instance, the connection between a client device and the application server is public. The connection between the application server and the database is private.
- DMZ (Demilitarized Zone): Services exposed to the internet should be isolated from internal services.
- Internal Subnets: Database servers and cache nodes should reside in subnets not directly accessible from the public internet.
- Encryption: Connections crossing trust boundaries should be noted as encrypted.
By marking these boundaries on the diagram, security teams can quickly verify that the architecture aligns with compliance requirements. If a database node is directly connected to the public internet in the diagram, it immediately flags a security risk.
📦 Managing Complexity in Microservices
The shift toward microservices architecture has complicated deployment diagrams significantly. In a monolithic system, one artifact might reside on one node. In a microservices system, dozens of artifacts might be distributed across dozens of nodes.
Handling Scale in Diagrams
When the number of nodes exceeds a manageable visual limit, abstraction techniques become necessary.
- Grouping: Use folders or containers to group related services. For example, a “Payment Service” container might hold the API, the worker, and the database.
- Replication Symbols: Indicate that a node is replicated without drawing every single instance. Use a multiplicity notation to show “5+ instances”.
- Aggregation: Group multiple similar nodes under a single logical name, such as “Worker Nodes”.
This approach keeps the diagram readable while preserving the truth of the architecture. It allows the team to see that there are five worker nodes without cluttering the canvas with five separate boxes.
Service Mesh Considerations
In advanced setups, a service mesh manages communication between services. While the mesh itself is infrastructure, it affects how services talk to each other. The deployment diagram should indicate the presence of a mesh layer, even if the internal routing logic is abstracted away.
- Draw the mesh as a distinct layer between services.
- Note that traffic passes through the mesh for observation and policy enforcement.
- Clarify that the mesh handles retries, timeouts, and circuit breaking.
This distinction helps developers understand that the communication protocol might be mTLS (mutual TLS) rather than standard HTTP, impacting how they debug network issues.
🔄 Integration with Operational Workflows
A deployment diagram that sits in a static document is a wasted asset. It must be integrated into the workflow of the team to remain relevant.
Version Control for Infrastructure
Just as source code is versioned, diagrams should be treated as code. Changes to the infrastructure topology should trigger updates to the diagram.
- Commit Messages: When a developer adds a new database cluster, the commit should reference the updated diagram.
- Review Process: Diagrams should be reviewed alongside pull requests that affect infrastructure.
- Documentation: Link the diagram version to the specific release tag in the repository.
This practice ensures that the diagram is never more than one commit behind the actual system state. It creates a single source of truth that evolves with the product.
CI/CD Pipeline Alignment
The Continuous Integration and Continuous Deployment pipeline is the engine that moves artifacts to the nodes shown in the diagram. The pipeline configuration must match the diagram.
- Environment Mapping: If the diagram shows Dev, Staging, and Prod environments, the pipeline must have distinct stages for each.
- Artifact Propagation: The same artifact version should move through the nodes in the diagram sequentially.
- Rollback Plans: The diagram should indicate which nodes are rolled back in the event of a failure.
Aligning the pipeline with the diagram reduces the risk of configuration drift. It ensures that the automated system does something different than what the documentation says.
🛠️ Common Errors and Corrections
Even experienced architects make mistakes when drawing these diagrams. Recognizing common pitfalls helps maintain accuracy.
1. Over-Engineering the Layout
Spending too much time aligning boxes perfectly distracts from the content. The goal is communication, not art. Use standard shapes and leave whitespace for clarity.
2. Ignoring Latency
If two services are on different nodes in different regions, the connection will have latency. The diagram should ideally note the region or network distance if it impacts performance.
3. Missing Failure Points
A diagram showing only success paths is misleading. It is valuable to indicate where a connection might break. For example, if a database connection relies on a specific network switch, that switch should be visible as a dependency.
4. Outdated Protocols
Many systems still use legacy protocols, but new ones are faster. Ensure the connection labels reflect the current implementation. Do not write “HTTP” if the connection is actually “gRPC” or “WebSocket”.
🔮 Future-Proofing Architecture
Technology changes. New protocols emerge, and infrastructure models shift. A deployment diagram must be flexible enough to accommodate these changes without requiring a complete redraw.
Focus on Logic, Not Hardware
Instead of drawing a specific server model, draw a “Compute Node”. Instead of drawing a specific database engine, draw a “Data Store”. This allows the underlying technology to change without breaking the diagram’s validity.
- Logical Nodes: Focus on the role (e.g., “API Gateway”) rather than the specific host.
- Generic Artifacts: Describe the software function rather than the specific binary name.
- Protocol Agnosticism: Where possible, describe the data exchange rather than the specific port number.
This approach extends the lifespan of the documentation. A team can migrate from one container orchestration platform to another without needing to update the diagram, provided the logical topology remains the same.
🤝 Collaborative Design Sessions
Creating a deployment diagram is often a group effort. It requires input from backend engineers, frontend engineers, and infrastructure specialists. Using a collaborative tool for this process ensures consensus.
Workshop Structure
- Initial Draft: The lead architect creates a rough draft based on requirements.
- Review Round: Backend engineers verify the server roles and database connections.
- Frontend Validation: Frontend engineers confirm the entry points and client-side requirements.
- Final Sign-off: The infrastructure team validates the network and security zones.
This collaborative process reduces silos. It ensures that everyone understands the constraints and capabilities of the system before writing a single line of code.
📉 The Cost of Missing Diagrams
What happens when a team operates without a deployment diagram? The consequences are often subtle but expensive.
- Debugging Time: Engineers spend hours tracing network paths manually instead of consulting a diagram.
- Configuration Drift: Teams make changes in the cloud console that are not documented, leading to discrepancies between the system and the docs.
- Knowledge Loss: When a senior engineer leaves, the infrastructure topology becomes a mystery to the remaining team.
- Security Gaps: Unintended public access to internal services goes unnoticed because the architecture was not visualized.
The cost of creating and maintaining the diagram is significantly lower than the cost of resolving the issues caused by its absence.
📝 Summary of Benefits
Deployment diagrams are not optional extras; they are core components of a mature engineering practice. They provide clarity in complexity, ensure security alignment, and facilitate collaboration across disciplines.
By focusing on logical groupings, maintaining version control, and integrating with operational workflows, teams can extract maximum value from these diagrams. The investment in documentation pays dividends in system stability and developer velocity.
For full-stack developers, mastering the art of deployment visualization is a critical skill. It bridges the gap between code and reality, ensuring that the software you build can survive in the real world.
- Clarity: Removes ambiguity about system topology.
- Communication: Provides a common language for all team members.
- Efficiency: Reduces time spent troubleshooting infrastructure issues.
- Security: Highlights trust boundaries and network risks.
Start by documenting your current state. Identify the nodes, the artifacts, and the connections. Once the baseline exists, you can begin to optimize, scale, and secure your architecture with confidence.

