


Building robust software requires more than just code. It requires alignment between the people writing the system and the people relying on it. When engineers present a deployment diagram to business leaders, product managers, or investors, the goal is not to impress with complexity. The goal is to illuminate the path forward. A deployment diagram can quickly become a wall of symbols that obscures meaning rather than revealing it. This guide explores practical methods to translate technical infrastructure into clear business value.
Effective communication bridges the gap between technical feasibility and business strategy. It ensures that resources are allocated correctly and that risks are understood before they become issues. By focusing on clarity and relevance, you can turn a complex architecture into a strategic asset.
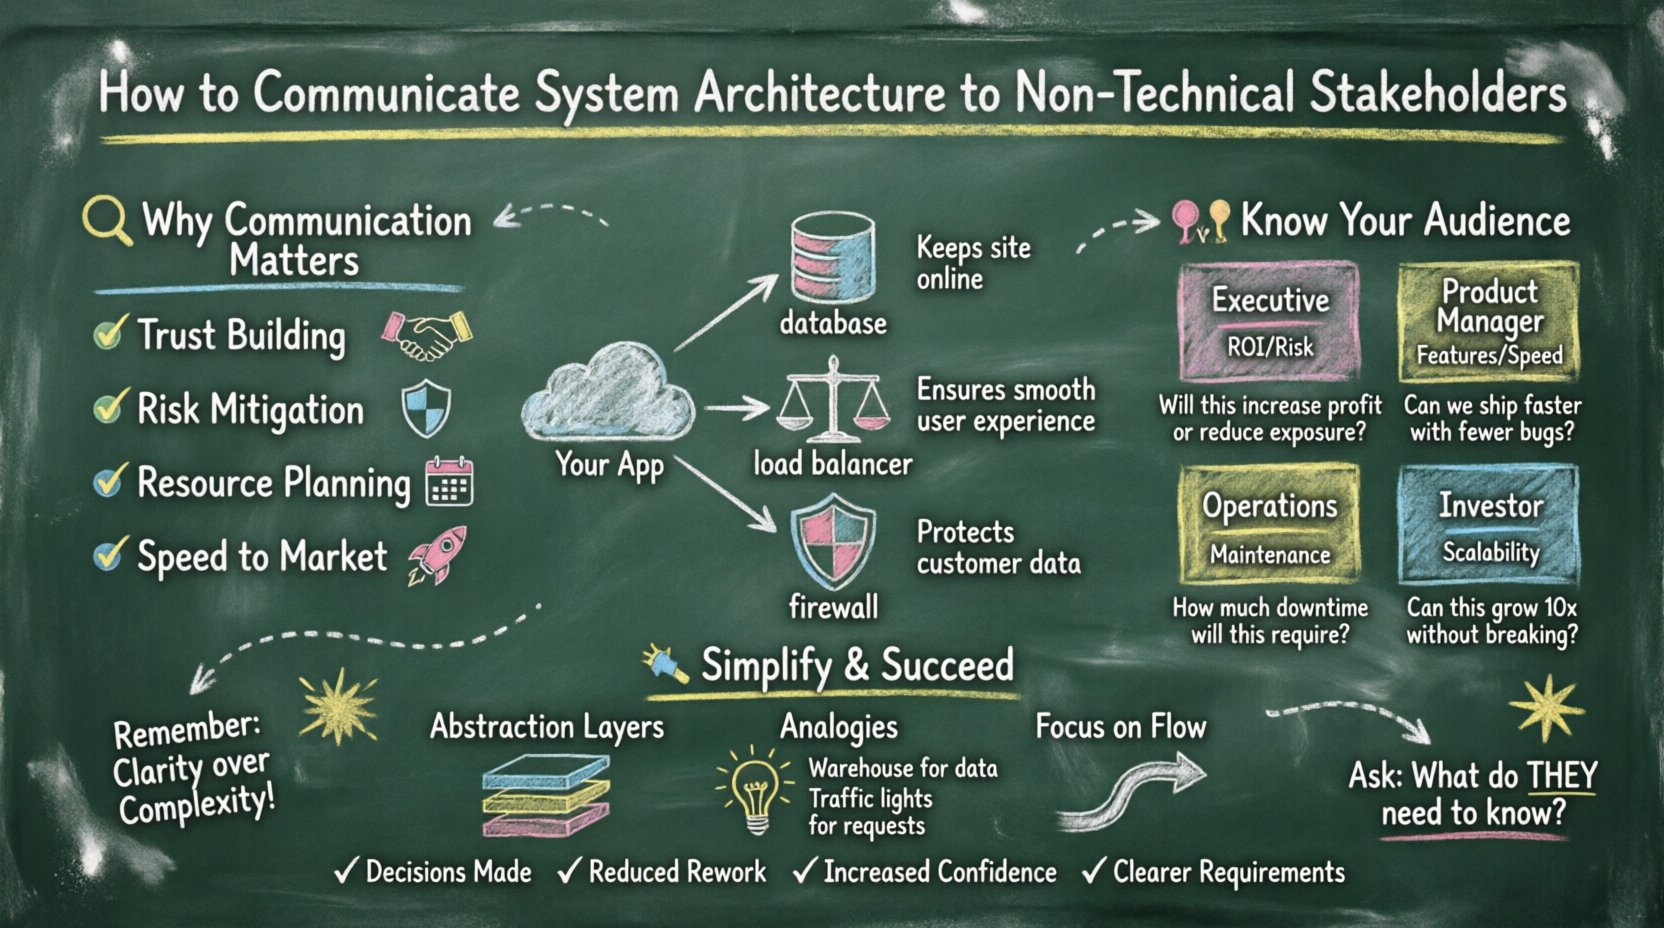
🔍 Why Communication Matters in System Design
Architecture decisions have financial implications. Every server, database connection, and security layer represents a cost and a risk. When stakeholders cannot understand the structure, they cannot make informed decisions about budget, timeline, or scope. Misalignment often leads to scope creep, unexpected costs, or security vulnerabilities that are discovered too late.
Clear communication serves several critical functions:
- Trust Building: When you explain technical constraints simply, stakeholders trust your judgment.
- Risk Mitigation: Understanding the architecture helps identify single points of failure early.
- Resource Planning: Knowing the infrastructure needs allows for accurate budgeting.
- Speed to Market: Decisions are faster when the implications of a design are clear.
Without this understanding, technical debt accumulates silently. Stakeholders may request features that are incompatible with the current infrastructure, leading to expensive rework later. Your role is to prevent this by making the invisible visible.
📊 Understanding the Deployment Diagram
A deployment diagram maps the physical hardware and software components of a system. It shows how different parts of the application interact with the underlying infrastructure. For a non-technical audience, this diagram often looks like a network of boxes and lines without context.
To communicate effectively, you must first understand the components yourself. A deployment diagram typically includes:
- Nodes: Representing physical or virtual machines, servers, or cloud instances.
- Processes: The running applications or services hosted on the nodes.
- Connections: The network paths and protocols used for communication.
- Artifacts: The software files or containers deployed on the nodes.
When presenting this to a business audience, the focus shifts from the “how” to the “why”. Instead of describing the specific port numbers or protocol versions, describe the flow of data and the reliability of the connection.
Technical vs. Business View
Different audiences look for different things in the same diagram. A table helps clarify these perspectives.
| Component | Engineer’s View | Business Stakeholder’s View |
|---|---|---|
| Load Balancer | Distributes traffic across multiple servers to prevent overload. | Ensures the website stays online even during high traffic. |
| Database Cluster | Redundant nodes with replication for data consistency. | Keeps customer data safe and accessible at all times. |
| API Gateway | Manages authentication and rate limiting for microservices. | Controls who can access the application and how many requests are allowed. |
| Firewall | Filters incoming and outgoing network traffic based on rules. | Protects sensitive information from unauthorized access. |
👥 Know Your Audience
Not all stakeholders have the same level of technical literacy or interest. Tailoring your message to the specific person in the room is essential. A Chief Financial Officer cares about cost and risk. A Product Manager cares about features and timelines. A Chief Technology Officer cares about scalability and security.
Identify the primary audience before preparing your presentation. Adjust the depth of detail and the language used accordingly.
Stakeholder Personas
| Persona | Primary Focus | Key Question to Answer |
|---|---|---|
| Executive Leadership | ROI, Risk, Strategy | Does this architecture support our long-term goals? |
| Product Managers | Features, Speed, Reliability | Can we build new features quickly on this? |
| Operations Team | Maintenance, Monitoring, Deployment | Is this easy to manage and fix? |
| Investors | Scalability, Security, Market Fit | Can this handle growth without breaking? |
🛠️ Simplification Techniques
Complexity is the enemy of understanding. You must simplify without losing accuracy. This does not mean dumbing down the content. It means removing unnecessary noise and highlighting the relevant connections.
1. Abstraction Layers
Do not show every single server if there are fifty of them. Group them into logical clusters. Use the concept of “zones” to represent different environments, such as production, staging, or development. This reduces the visual clutter and focuses attention on the critical paths.
2. Analogies and Metaphors
Comparing technical concepts to everyday objects helps non-technical stakeholders grasp the idea quickly. However, use analogies carefully to avoid oversimplification.
- Warehouse Analogy: Think of the database as a warehouse where inventory is stored. The API is the conveyor belt moving goods in and out.
- Traffic Analogy: The load balancer is like a traffic officer directing cars to different lanes to prevent a jam.
- Security Analogy: The firewall is like a security guard checking IDs at the entrance.
3. Focus on Flow, Not Structure
Stakeholders often care more about how data moves than where it sits. Draw arrows to show the direction of data flow. Highlight the critical steps where data is processed or stored. If a step fails, what happens to the user experience? Make the consequences clear.
🎨 Visual Design Principles
The way you draw the diagram matters as much as the content. A cluttered diagram will be ignored. A clean diagram will be studied. Use visual hierarchy to guide the eye.
- Color Coding: Use colors to indicate status or ownership. For example, green for production, red for development, or different colors for different security zones.
- Size Matters: Make critical components larger. If the database is the heart of the system, make it visually prominent.
- Whitespace: Leave space between components. Crowded lines create confusion. Use whitespace to separate distinct logical groups.
- Minimal Labels: Avoid long text blocks. Use short, descriptive labels. Explain the details verbally rather than writing them on the diagram.
🗣️ Managing the Conversation
Presenting the architecture is a dialogue, not a monologue. Be prepared for questions and objections. Listen actively to understand the underlying concerns.
Anticipate Questions
Before the meeting, list the questions you expect. Prepare answers that address both technical and business implications.
- What happens if a server fails? Explain the redundancy and failover mechanisms.
- How do we scale? Describe how new servers can be added automatically.
- What is the cost? Break down the infrastructure costs in relation to expected usage.
Handling Objections
Stakeholders may push back on technical recommendations. They might want to cut costs or speed up delivery in ways that compromise the architecture. Acknowledge their concerns and explain the trade-offs clearly.
Instead of saying “No, we can’t do that,” say “We can do that, but it will increase the risk of downtime. Here is the data on that risk.” This shifts the conversation from technical refusal to risk management.
⚠️ Common Pitfalls to Avoid
Even experienced engineers make mistakes when communicating architecture. Be aware of these common traps.
- Jargon Overload: Avoid acronyms like “DNS,” “SSL,” “TCP/IP,” or “Microservices” without defining them first.
- Over-Engineering: Do not design for hypothetical problems that will never happen. Focus on the current needs.
- Ignoring the User: Remember that the end-user experience is the ultimate measure of success. Connect the architecture to the user experience.
- Assuming Knowledge: Do not assume the audience knows what a “container” or “orchestration” is. Explain these concepts in plain language.
🔄 Feedback and Iteration
Communication is a continuous process. After the meeting, gather feedback. Did they understand the diagram? Were there any points of confusion? Use this feedback to improve future presentations.
Create a feedback loop where stakeholders can ask questions after the initial presentation. Provide a simplified version of the diagram as a handout or digital document they can reference later.
📈 Measuring Success
How do you know if your communication was effective? Look for signs of alignment and action.
- Decisions Made: Are stakeholders making decisions based on the information provided?
- Reduced Rework: Are there fewer requests to change the architecture later due to misunderstandings?
- Increased Confidence: Do stakeholders express confidence in the roadmap and timeline?
- Clearer Requirements: Are business requirements becoming more specific and feasible?
Success is not just about delivering a diagram. It is about enabling the business to move forward with a clear understanding of the technical landscape. When the architecture is understood, the team can focus on building value rather than explaining constraints.
🚀 Moving Forward
Effective communication is a skill that improves with practice. Start by observing how your audience reacts to technical explanations. Adjust your approach based on their feedback. Over time, you will develop a style that resonates with both engineers and business leaders.
Remember that your goal is partnership. You are not just presenting a diagram; you are building a shared vision for the product. By prioritizing clarity, empathy, and relevance, you can turn complex system architecture into a powerful tool for business growth.
Invest time in understanding your audience. Respect their time and expertise. Present the deployment diagram not as a technical artifact, but as a map for the journey ahead. With the right approach, every stakeholder becomes a partner in the success of the system.

