


Production environments are complex ecosystems. They involve a network of servers, storage systems, load balancers, databases, and application nodes working in unison. When any single component fails or interacts incorrectly with another, the entire system can suffer downtime, data loss, or degraded performance. These failures are not merely technical inconveniences; they represent significant financial loss and erosion of user trust.
To navigate this complexity, software architects rely on visual blueprints. Among these, the deployment diagram stands out as a critical artifact. It maps the physical hardware and software architecture, providing a clear view of how software artifacts are distributed across nodes. By visualizing the infrastructure before code is pushed to production, teams can identify risks, validate configurations, and streamline the deployment process.
🧭 Understanding the Deployment Diagram
A deployment diagram is a type of diagram used in modeling software systems to show the physical architecture of a system. Unlike a class diagram which focuses on code structure, or a sequence diagram which focuses on interactions over time, a deployment diagram focuses on the topology. It illustrates the hardware nodes, the software components residing on them, and the communication pathways connecting them.
Think of it as a map for the infrastructure. Just as a city planner needs a map to understand traffic flow and zoning before building a new road, a development team needs a deployment diagram to understand data flow and resource allocation before launching an application.
Key Elements of a Deployment Diagram
- Nodes: Represent physical or virtual computing resources. This could be a physical server, a virtual machine, a cloud instance, or a container runtime environment.
- Artifacts: The software packages that run on the nodes. These include executables, libraries, database schemas, or configuration files.
- Connectors: Represent the communication paths between nodes or between artifacts and nodes. This includes network protocols like HTTP, TCP/IP, or message queues.
- Interfaces: Define the points of interaction between the software artifacts and the underlying nodes or other systems.
🔍 Visualizing Infrastructure Topology
One of the primary benefits of creating a deployment diagram is the clarity it brings to infrastructure topology. In large-scale systems, developers often have a mental model of how the system works, but this model is rarely accurate across the entire team. Discrepancies between what developers believe is running and what is actually running in production are a common source of errors.
By documenting the topology, teams establish a single source of truth. This ensures that everyone from the backend engineers to the operations staff understands the physical layout. This shared understanding is vital for troubleshooting and planning.
Benefits of Topology Visualization
- Reduced Cognitive Load: Engineers do not need to memorize the entire infrastructure. They can refer to the diagram to understand dependencies.
- Consistency: Ensures that development, testing, and production environments are modeled consistently, reducing environment-specific bugs.
- Onboarding: New team members can quickly grasp the system architecture without needing to dig through configuration files or server logs.
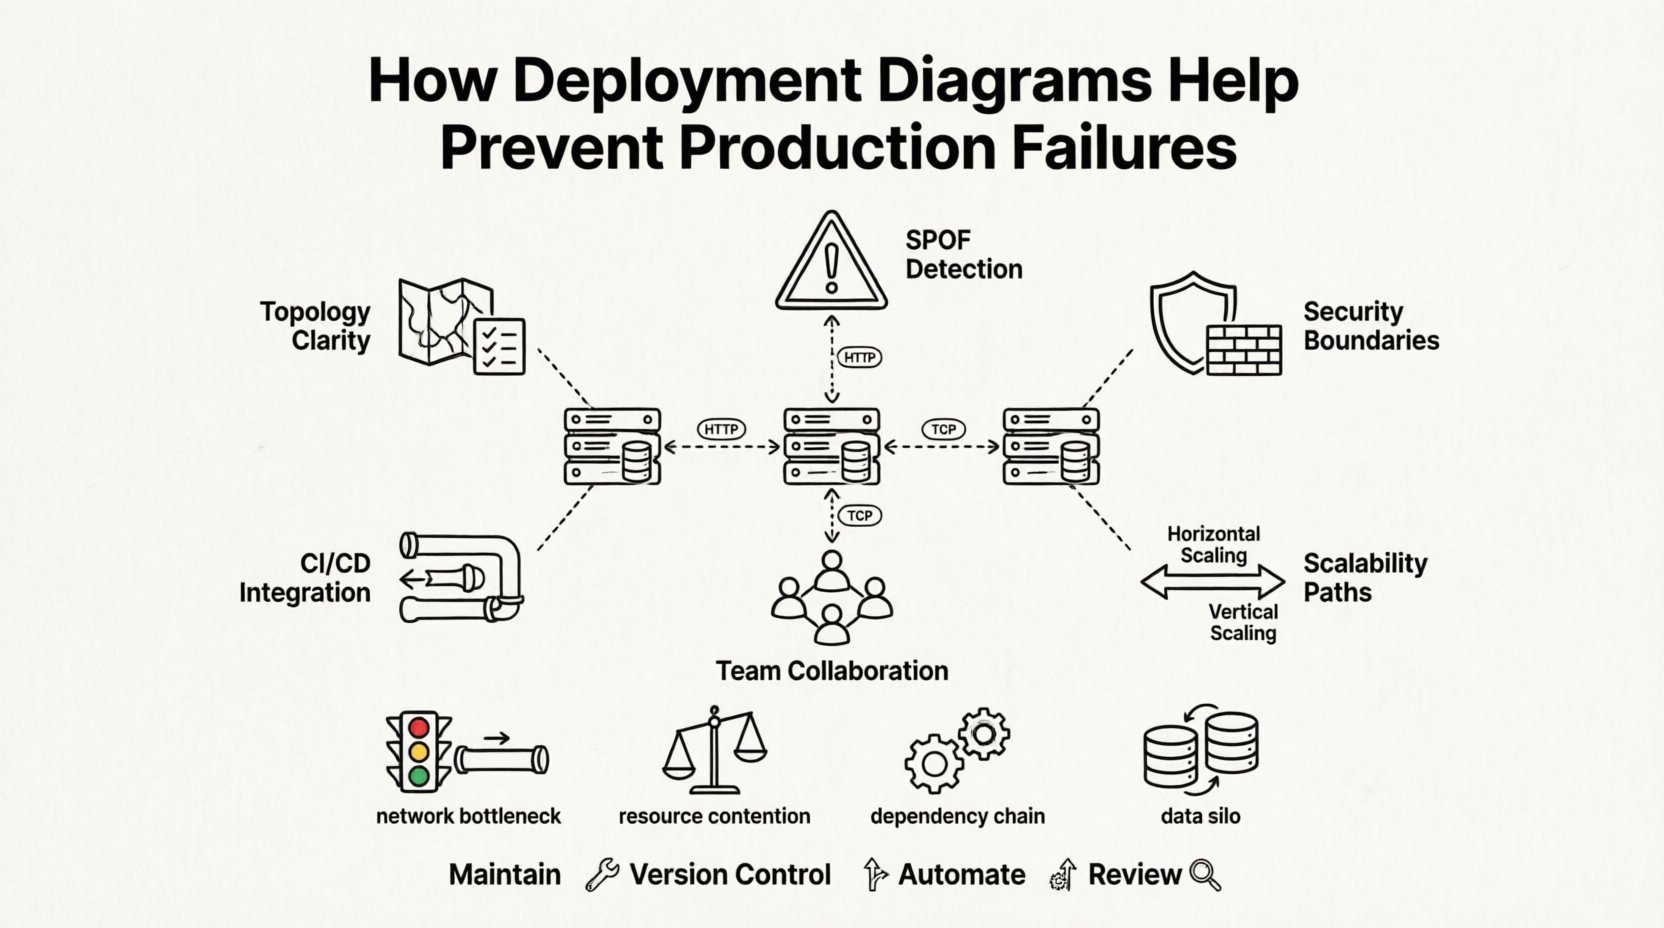
🚨 Identifying Single Points of Failure
A production failure often stems from a single point of failure (SPOF). This is a component of the system where a breakdown will cause the entire system to fail. In the absence of a visual representation, SPOFs can easily be overlooked during the design phase. Deployment diagrams force architects to consider redundancy and fault tolerance explicitly.
When drawing the diagram, teams must decide where to place replicas of critical services. If a database node is shown as a single instance with no connection to a backup or failover node, the diagram highlights this risk immediately. It prompts a discussion: “What happens if this server goes down?”
Common Risks Visualized by Diagrams
| Risk Category | Description | Mitigation Strategy |
|---|---|---|
| Network Bottlenecks | High traffic between specific nodes causing latency. | Add load balancers or increase bandwidth capacity. |
| Resource Contention | Multiple heavy processes running on the same node. | Isolate services onto separate nodes or containers. |
| Dependency Chains | Service A waits for Service B which is slow. | Implement asynchronous processing or caching. |
| Data Silos | Database instances not synchronized, causing data inconsistency. | Implement replication or shared storage solutions. |
By reviewing the diagram, architects can spot these patterns before deployment. For instance, if all microservices are mapped to a single cluster without horizontal scaling capabilities, the risk of performance degradation during traffic spikes is evident. The diagram serves as a checkpoint to validate the resilience of the architecture.
🔒 Security and Compliance Planning
Security is not an afterthought; it must be embedded in the architecture. Deployment diagrams play a crucial role in security planning by defining trust boundaries. They show which nodes are accessible from the public internet and which are isolated within a private network. This distinction is vital for compliance with standards such as GDPR or HIPAA, which require specific handling of data.
When visualizing the infrastructure, teams can identify where encryption is required. For example, data flowing between a client node and a server node should be encrypted. The diagram helps ensure that firewalls and security groups are configured to match the architectural design. If a diagram shows a database node exposed to an unsecured network, it is an immediate red flag.
Security Considerations in Diagrams
- Access Control: Clearly marking which nodes require authentication and which are public-facing.
- Data Flow: Tracking where sensitive data resides and how it moves between nodes.
- Network Segmentation: Visualizing the separation between development, staging, and production environments to prevent unauthorized access.
- Physical Security: Noting if hardware requires physical access controls, which is relevant for on-premise infrastructure.
📈 Scalability and Capacity Modeling
As an application grows, the infrastructure must grow with it. Scalability is the ability of a system to handle increased load. Deployment diagrams help model this growth. By representing nodes and their relationships, teams can plan for horizontal scaling (adding more nodes) versus vertical scaling (upgrading existing nodes).
For example, if a diagram shows a monolithic application running on a single server, scaling is difficult. If the diagram is refactored to show a load balancer distributing traffic across multiple application servers, the path to scalability is clear. This planning prevents the “firefighting” scenario where teams scramble to fix infrastructure issues during a traffic surge.
Scaling Strategies Visualized
- Horizontal Scaling: Adding identical nodes to distribute the load. The diagram shows multiple application servers behind a load balancer.
- Vertical Scaling: Increasing the resources of a single node. The diagram might annotate a node with higher CPU or RAM requirements.
- Geographic Distribution: Placing nodes in different regions to reduce latency for global users. The diagram maps nodes to specific geographic locations.
- Auto-Scaling Groups: Defining rules for when new nodes should be added. This is often documented alongside the diagram in configuration files.
🤝 Collaboration Between Teams
Modern software development involves multiple disciplines. Developers write code, operations manage infrastructure, and security teams enforce policies. These groups often speak different languages. A deployment diagram acts as a universal translator. It allows developers to see where their code will run and allows operations teams to see what resources the code requires.
This collaboration reduces friction during the deployment process. When operations teams understand the application architecture, they can provision resources more accurately. When developers understand the infrastructure constraints, they can write more efficient code. The diagram facilitates this alignment by providing a shared visual context.
Improving Communication Flow
- Shared Understanding: Everyone looks at the same map. There is no ambiguity about where components reside.
- Change Management: When a change is proposed, the impact can be visualized on the diagram before it is implemented.
- Incident Response: During an outage, the diagram helps teams quickly identify which node is affected and how it impacts other services.
- Documentation: The diagram serves as living documentation that stays updated with the architecture, rather than outdated text files.
🔄 Integration with Deployment Pipelines
The deployment diagram is not just a static document; it should inform the automated deployment pipeline. Continuous Integration and Continuous Deployment (CI/CD) pipelines rely on configuration data to deploy applications. This configuration data is often derived from the architectural design shown in the diagram.
If the diagram specifies a database cluster, the pipeline must include steps to provision that cluster. If it specifies a specific network topology, the pipeline must configure firewalls and routing accordingly. This alignment ensures that the code being deployed matches the infrastructure it is intended to run on. It prevents the common error of deploying code that assumes an architecture that does not exist.
Automated Infrastructure Checks
- Validation: Scripts can parse the diagram to verify that the target environment matches the expected topology.
- Drift Detection: Comparing the live environment against the diagram to detect configuration drift.
- Resource Provisioning: Using the diagram as a template to generate infrastructure-as-code scripts.
- Rollback Planning: Understanding the dependencies in the diagram helps in planning safe rollback procedures if a deployment fails.
🛠️ Troubleshooting Post-Deployment
Even with the best planning, issues arise in production. When they do, a deployment diagram is an invaluable tool for troubleshooting. Instead of guessing where the problem might be, engineers can trace the data flow on the diagram to find the bottleneck or failure point.
For example, if a service is slow, the diagram shows which other services it depends on. If those dependencies are also under load, the root cause is identified. If the diagram shows a direct connection between two nodes that usually communicate via a queue, the team knows to check for misconfiguration. The diagram provides the context needed to diagnose issues rapidly.
📝 Best Practices for Diagram Maintenance
A deployment diagram is only useful if it is accurate. An outdated diagram is worse than no diagram at all, as it creates false confidence. Therefore, maintaining the diagram is a critical task. It should be treated as part of the codebase, updated whenever the infrastructure changes.
Maintenance Guidelines
- Version Control: Store diagram files in the same repository as the code to ensure they are updated together.
- Review Process: Include diagram updates in the code review process. No deployment should be merged without verifying the architecture diagram reflects the changes.
- Automation: Use tools that can generate diagrams from infrastructure configuration files to reduce manual effort and errors.
- Clarity: Keep the diagram clean. Avoid cluttering it with too much detail. Focus on the logical deployment structure rather than every single cable or minor setting.
🚀 Conclusion
Preventing production failures requires foresight and precision. It is not enough to write good code; the environment in which that code runs must be robust, secure, and well-understood. Deployment diagrams provide the necessary visibility into this environment. They transform abstract concepts into concrete visual models that can be analyzed, challenged, and improved.
By investing time in creating and maintaining these diagrams, organizations reduce the risk of downtime, improve security posture, and foster better collaboration between teams. The cost of creating a diagram is far lower than the cost of recovering from a major production failure. In the complex world of software infrastructure, the deployment diagram is not just a drawing; it is a fundamental tool for reliability.
As systems continue to grow in complexity, the role of architectural visualization will only become more critical. Teams that prioritize these visual blueprints will find themselves better equipped to handle the challenges of modern deployment environments. The path to stability is paved with clear understanding, and deployment diagrams offer that clarity.

