


Understanding the architecture of complex software systems requires precise modeling tools. Among the Unified Modeling Language (UML) diagrams, the Deployment Diagram serves a critical role in visualizing the physical architecture of a system. It maps software artifacts to hardware nodes, illustrating how the system is physically deployed. However, practitioners often struggle with the nuances of this diagram type. Misunderstandings can lead to documentation that fails to communicate the true infrastructure needs, causing friction between development and operations teams. 🧠
This guide addresses the frequent errors made when constructing these diagrams. We will explore the semantic distinctions between nodes, artifacts, and components. We will also examine the nature of connections and the appropriate level of abstraction. By clarifying these points, you can create documentation that stands the test of time and accurately reflects the system’s reality. Let us dive into the specifics. 📊
1. The Hardware vs. Software Confusion 🖥️
A prevalent error is treating the Deployment Diagram solely as a hardware map. While it certainly depicts hardware nodes, its primary value lies in showing how software runs on that hardware. If you only draw servers, switches, and routers without the software layers, the diagram loses its specific utility for software architects.
- The Reality: A Deployment Diagram shows both the physical environment and the logical software packages residing within it.
- The Mistake: Drawing a network topology map instead of a software deployment map.
- The Impact: Development teams cannot see where the binaries go, and operations teams do not see the resource requirements for the code.
To avoid this, ensure every physical node has a corresponding deployment target for your software components. Use the stereotype <<deployment>> or simply label the node clearly. This distinguishes the physical machine from the software artifact it hosts. Think of the node as the container and the artifact as the content. Both are necessary for a complete picture. 📦
2. Static Structure vs. Dynamic Behavior 🔄
Deployment Diagrams are often confused with Sequence Diagrams or Activity Diagrams. The former shows structure; the latter shows flow. A Deployment Diagram is static. It represents a snapshot of the system at a specific point in time. It does not show how data moves over time, how processes start and stop, or the timing of interactions.
- The Reality: Deployment Diagrams describe the topology and the static distribution of components.
- The Mistake: Adding arrows that imply control flow or message passing between nodes.
- The Impact: Readers may assume a specific execution path or timing constraint that does not exist in the actual system.
When you need to show how processes interact or how data flows over time, use a Sequence Diagram or a Communication Diagram instead. Keep the Deployment Diagram focused on the “where” and “what” of the system, not the “how” or “when”. This separation of concerns maintains clarity. 🧭
3. Component vs. Artifact Distinction 🧩
The UML standard distinguishes between a Component and an Artifact, but these are often used interchangeably in practice. This lack of precision creates ambiguity in the documentation. A Component represents a modular part of the system’s software structure. An Artifact represents a physical piece of information, such as a file, a library, or a database schema. 📄
Confusing these two can lead to confusion regarding versioning and physical storage. For example, a compiled executable is an Artifact. The module it implements is a Component. The Deployment Diagram should show Artifacts deployed on Nodes. Components are often realized by Artifacts. Understanding this relationship is crucial for accurate modeling.
| Concept | Definition | Example |
|---|---|---|
| Node | Computational resource | Server, Router, Mobile Device |
| Component | Modular software unit | User Interface Module, Payment Service |
| Artifact | Physical implementation unit | .exe file, .jar file, SQL Script |
| Association | Structural link | Node contains Artifact |
By adhering to these definitions, your diagrams will align better with the UML specification. This ensures that anyone reading the model understands the physical implications of the design. 🛡️
4. Connectivity and Communication Paths 🌐
Another common pitfall involves the lines connecting the nodes. In a Deployment Diagram, connections represent communication paths. They are not the same as the structural associations found in Class Diagrams. A communication path defines the protocol and the medium of transport. It answers the question: “How do these nodes talk to each other?”
- The Reality: Use Stereotypes like <<TCP/IP>>, <<HTTP>>, or <<Local>> to define the nature of the connection.
- The Mistake: Using simple lines without labels, implying a direct physical cable exists between every connected node.
- The Impact: Security teams may overlook network segmentation requirements, assuming all nodes are on the same local subnet.
Always label your communication paths with the protocol. If a connection crosses a firewall or goes over the internet, indicate that. This adds security context to the architectural model. It helps DevOps engineers configure firewalls and load balancers correctly based on the model. 🔒
5. Level of Detail and Abstraction 📉
There is no single “correct” level of detail for a Deployment Diagram. The right level depends on the audience and the stage of the project. A diagram for high-level stakeholders needs to show the major regions and critical servers. A diagram for DevOps engineers needs to show container instances, specific ports, and environment variables.
Trying to show everything in one diagram is a recipe for confusion. If you include every microservice instance, the diagram becomes unreadable. If you omit critical dependencies, it becomes useless. The solution is to use multiple diagrams at different levels of granularity. 📚
- High-Level View: Show data centers, clouds, and major regions.
- System View: Show specific application servers and databases.
- Instance View: Show specific container replicas and node IPs (if required for troubleshooting).
Reference these diagrams from a master index. This keeps the documentation organized and manageable. Do not force a single diagram to serve every purpose. Modularity applies to documentation just as it does to code. 🧱
6. Static Snapshots vs. Dynamic Environments 🔄
Cloud environments are dynamic. Instances spin up and down. Load balancers shift traffic. A Deployment Diagram is inherently static. It cannot capture the elasticity of a cloud-native architecture without becoming cluttered. Relying on a static image to represent a dynamic system can be misleading. 🌥️
Instead of trying to draw every possible state, focus on the template or the pattern. Show the types of nodes available rather than the specific count. Use stereotypes to denote that a node is an “Auto-scaling Group” or a “Serverless Function”. This conveys the capability of the infrastructure without committing to a specific number of running instances.
When documenting for dynamic systems, pair the Deployment Diagram with a narrative description of the scaling policies. The diagram shows the structure; the text explains the behavior. This combination provides a complete picture of the operational reality. 📝
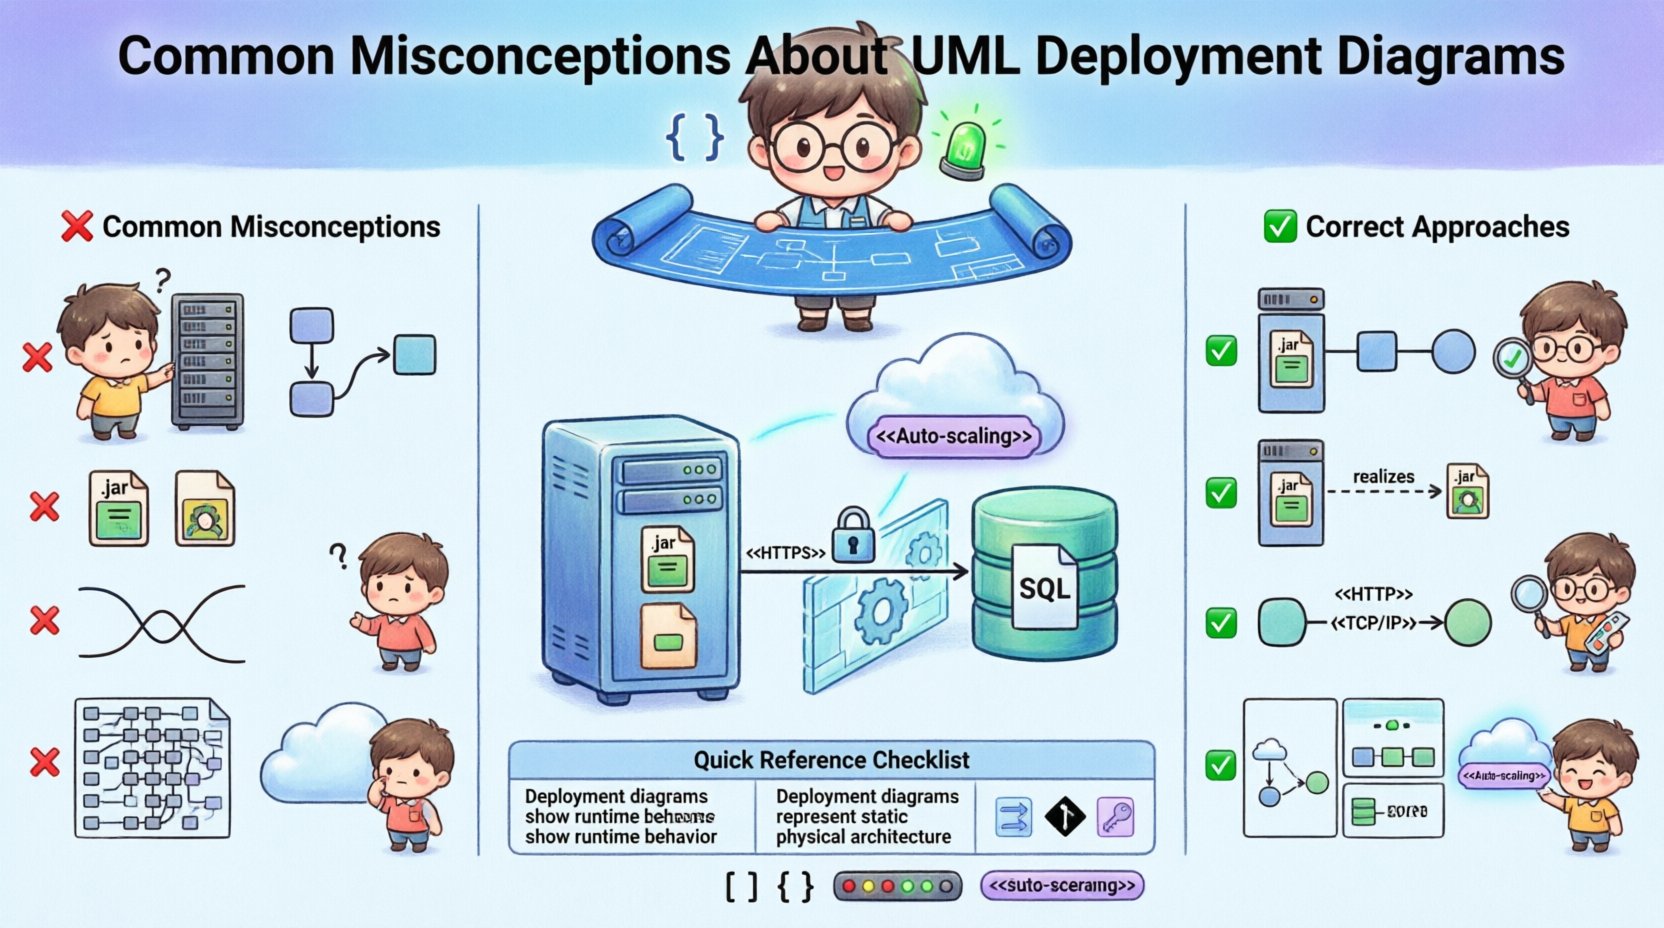
7. Misconception Table: Quick Reference ⚡
Here is a summary of the most common errors and the correct approaches to take. Use this as a checklist before finalizing your diagrams.
| Misconception ❌ | Correct Approach ✅ | Why It Matters |
|---|---|---|
| Only drawing hardware | Include software artifacts on nodes | Shows deployment targets for code |
| Showing runtime flow | Focus on static structure only | Prevents confusion with Sequence Diagrams |
| Using generic lines | Label communication paths (e.g., HTTP) | Clarifies security and network protocols |
| One diagram for all | Use multiple levels of abstraction | Keeps documentation readable and targeted |
| Ignoring interfaces | Define provided/required interfaces | Clarifies dependencies between nodes |
| Static cloud view | Use stereotypes for dynamic nodes | Accurately reflects cloud elasticity |
8. Best Practices for Maintenance 🛠️
Once the diagram is created, it must be maintained. Software architecture changes frequently. If the diagram does not reflect the current state, it becomes a liability. Teams will stop trusting it, and eventually, they will stop using it. 📉
Here are strategies to keep your diagrams current:
- Integrate with CI/CD: If possible, generate parts of the diagram from infrastructure-as-code files. This reduces manual updates.
- Review During Sprints: Include architecture updates in the definition of done for relevant tasks.
- Version Control: Treat diagrams as code. Store them in the same repository as the application source code.
- Clear Legend: Always include a legend for any custom stereotypes or shapes used. This ensures consistency across the team.
Documentation is a living artifact. It requires the same discipline as the code it describes. Regular reviews prevent technical debt in the documentation itself. A diagram that is five years out of date is worse than no diagram at all. ⏳
9. Integration with Other UML Diagrams 🧩
A Deployment Diagram does not exist in isolation. It connects to the rest of the UML model. Understanding these relationships strengthens the overall system description.
- Component Diagram: The Deployment Diagram realizes the Component Diagram. The components defined in the logical model are deployed as artifacts on the nodes in the physical model.
- Class Diagram: The Class Diagram defines the internal structure of the components. The Deployment Diagram defines the external location of those components.
- Use Case Diagram: The Use Case Diagram defines the functional requirements. The Deployment Diagram shows where the actors and the system meet physically.
When creating a Deployment Diagram, reference the Component Diagram to ensure all necessary artifacts are included. If a component is missing from the deployment model, it means the system is not fully defined. This cross-referencing ensures consistency across the entire architectural blueprint. 🔗
10. Addressing Security Implications 🔐
Security is often an afterthought in architectural diagrams. However, the Deployment Diagram is the perfect place to highlight security boundaries. You can visually separate trusted zones from untrusted zones. 🚧
Consider the following security markers:
- Firewalls: Draw them between network nodes. Label them with the rules they enforce.
- DMZs: Clearly mark the Demilitarized Zone. Show that external traffic must pass through this layer before reaching internal databases.
- Encryption: Indicate where data is encrypted in transit (e.g., SSL/TLS on the communication path) and at rest (e.g., on the database node).
By embedding security constraints directly into the topology, you make the security architecture explicit. This helps auditors and security engineers understand the compliance posture of the system without needing a separate security document. It promotes a “Security by Design” mindset. 🛡️
11. Handling Complex Topologies 🏗️
In large-scale systems, the topology can become extremely complex. A single node might have dozens of connections. A network might span multiple continents. In these cases, simplification is key. Do not attempt to draw every cable. 🌍
Use grouping stereotypes to aggregate similar nodes. For example, a “Web Server Cluster” can be represented as a single node group, with a note indicating the internal load balancing mechanism. This reduces visual noise while preserving the logical structure. It allows the reader to understand the high-level flow without getting lost in the details of the cluster internals.
Furthermore, consider using sub-diagrams. If a data center has a complex internal mesh, document that in a separate file. Reference it from the main diagram. This hierarchical approach keeps the main overview clean and the detailed views accessible when needed. 🗺️
12. Common Pitfalls in Tool Usage 🧰
Many practitioners rely on diagramming tools that enforce their own logic rather than UML standards. This can lead to diagrams that look pretty but are semantically incorrect. For example, some tools allow you to draw a line between two components without defining a dependency. This creates a visual link that means nothing to the UML parser. 🔌
To avoid this:
- Validate against UML Standards: Check that your tool supports the specific stereotypes you are using.
- Use Standard Shapes: Stick to the standard UML shapes for Nodes and Artifacts. Avoid custom icons unless they are clearly defined in a legend.
- Export to Standard Formats: If you need to share the diagram with others, export it to XMI or a standard image format that preserves the metadata.
Using a tool that understands the semantics of the model ensures that the diagram is not just a picture, but a structured representation of the system. This is vital for tooling integration and automation. ⚙️
Summary of Key Takeaways 📝
Creating effective UML Deployment Diagrams requires discipline and a clear understanding of the underlying standards. It is not enough to simply draw boxes and lines. You must understand the semantics of Nodes, Artifacts, and Communication Paths. You must distinguish between static structure and dynamic behavior. You must choose the appropriate level of detail for your audience.
By avoiding the common misconceptions outlined in this guide, you can produce documentation that is accurate, maintainable, and valuable. These diagrams serve as a bridge between the software developers and the operations teams. They ensure that the code that is written is the code that is deployed. In a world of complex infrastructure, clarity is the most important asset you can provide. 🚀
Take the time to review your diagrams. Check them against the checklist provided. Ensure every connection has a purpose and every label is accurate. Your future self, and your colleagues, will thank you for the clarity. Keep the documentation clean, precise, and up-to-date. That is the mark of a professional architect. 👨💻👩💻
")
