In the modern enterprise landscape, the relationship between Information Technology and business strategy often feels like two separate trains running on parallel tracks. IT departments frequently invest heavily in infrastructure, security, and applications, yet struggle to articulate the direct value generated for the organization. Stakeholders demand clarity on return on investment, while IT leaders seek validation that their efforts drive tangible results. This disconnect creates friction and obscures the true contribution of technology to the bottom line.
To bridge this gap, organizations require a structured framework that translates technical activities into business language. The Business Motivation Model (BMM) offers a robust standard for achieving this alignment. By defining the drivers, goals, and plans of an organization, BMM allows IT teams to map their capabilities directly to strategic objectives. This guide explores how to utilize this model to quantify IT contributions, ensuring every line of code and server configuration supports the broader mission of the enterprise.
🧩 Understanding the Business Motivation Model Framework
The Business Motivation Model is not merely a charting tool; it is a comprehensive conceptual framework designed to capture the essential elements of business motivation. Originally developed by the Object Management Group (OMG), it provides a vocabulary for describing the factors that influence business behavior. Instead of focusing solely on processes or systems, BMM focuses on the why behind the actions.
At its core, the model distinguishes between the internal drivers of an organization and the external forces that impact it. It creates a clear line of sight from high-level aspirations down to the specific tasks performed daily. For IT professionals, this structure is invaluable because it moves the conversation away from uptime and ticket resolution rates, and towards revenue generation, risk reduction, and customer satisfaction.
Key characteristics of the BMM approach include:
- Intent-based: It starts with what the business wants to achieve, rather than what resources it has.
- Flexible: It applies to any size of organization, from startups to global enterprises.
- Traceable: It allows for tracing a specific task back to a high-level strategic goal.
- Dynamic: It accommodates changes in strategy without requiring a complete overhaul of the model.
When applied to IT, the model forces a re-evaluation of how success is defined. A server cluster is not just a collection of hardware; it is a resource intended to support a specific business goal. Understanding this distinction is the first step in quantification.
🎯 Connecting IT Capabilities to Strategic Goals
The primary challenge in measuring IT value lies in the abstraction layer. IT speaks in technical metrics (latency, throughput, availability), while business speaks in financial and operational metrics (revenue, market share, customer retention). BMM acts as the translator between these two dialects.
To effectively connect IT capabilities to strategic goals, one must understand the hierarchy of motivation within the organization. The model organizes elements into specific categories that help in this mapping process. IT should not be viewed as a siloed function but as an enabler of the broader business structure.
The following table illustrates how IT artifacts map to BMM elements:
| BMM Element | Business Definition | IT Equivalent Example |
|---|---|---|
| Goal | A state of affairs the organization wishes to achieve. | Increase online sales by 15%. |
| Objective | Specific, measurable steps toward a Goal. | Reduce checkout page load time to under 2 seconds. |
| Plan | A collection of activities to achieve an Objective. | Implement caching layer and optimize database queries. |
| Task | A specific unit of work. | Deploy Redis cluster to production servers. |
| Resource | Things needed to perform work. | Compute instances, network bandwidth, developer hours. |
| Principle | Guiding rules that restrict or enable actions. | All customer data must be encrypted at rest. |
| Obstacle | Factors that hinder progress. | Legacy system incompatibility, budget constraints. |
By populating this table for various IT initiatives, leaders can visualize the flow of value. If a Task does not link to a Plan, which links to an Objective, which links to a Goal, it may be a candidate for elimination. This process ensures that IT efforts are not wasted on activities that do not contribute to the business motivation.
📏 The Core Components of BMM for Measurement
To quantify contributions, you must identify the specific components within the BMM that represent value. These components serve as the anchors for measurement. Without them, metrics are isolated data points without context.
1. Goals and Objectives
Goals represent the desired end state. They are often qualitative but must be grounded in reality. Objectives break these down into quantifiable targets. In an IT context, a Goal might be “Improve Customer Experience.” The corresponding Objectives could be “Reduce support ticket volume by 20%” or “Increase application response speed by 50%.” Measuring IT contributions requires linking technical performance to these specific objectives.
2. Principles
Principles act as guardrails. They define the constraints within which the business operates. For IT, principles often relate to compliance, security, and architecture standards. A principle like “Data Privacy is paramount” dictates that IT investments in security are not optional costs but mandatory enablers of the business model. Quantifying the value of a principle often involves measuring risk avoidance rather than direct revenue.
3. Obstacles
Obstacles are the barriers preventing the achievement of goals. Identifying these is crucial for prioritization. If an obstacle is “High latency in legacy systems,” then IT contributions are measured by how effectively that latency is reduced. Understanding obstacles helps in framing the narrative of IT success: we are removing barriers to business growth.
4. Plans and Tasks
Plans are the strategies employed to achieve objectives. Tasks are the execution of those strategies. In a BMM context, IT projects are Plans. Each sprint or deployment is a Task. To quantify value, one must assess whether the completion of Tasks led to the fulfillment of Plans, and if those Plans effectively addressed the Obstacles or advanced the Objectives.
5. Resources
Resources are the inputs required to perform work. In IT, this includes hardware, software licenses, personnel, and time. By tracking resource consumption against the achievement of Goals, organizations can calculate efficiency ratios. For example, if a specific resource allocation led to a significant drop in Obstacles, the value of that resource is high.
💰 Building the Value Chain from IT to Revenue
One of the most difficult aspects of IT measurement is establishing a direct link to revenue. While infrastructure does not generate revenue directly, it enables the functions that do. The Business Motivation Model helps construct this chain of causality.
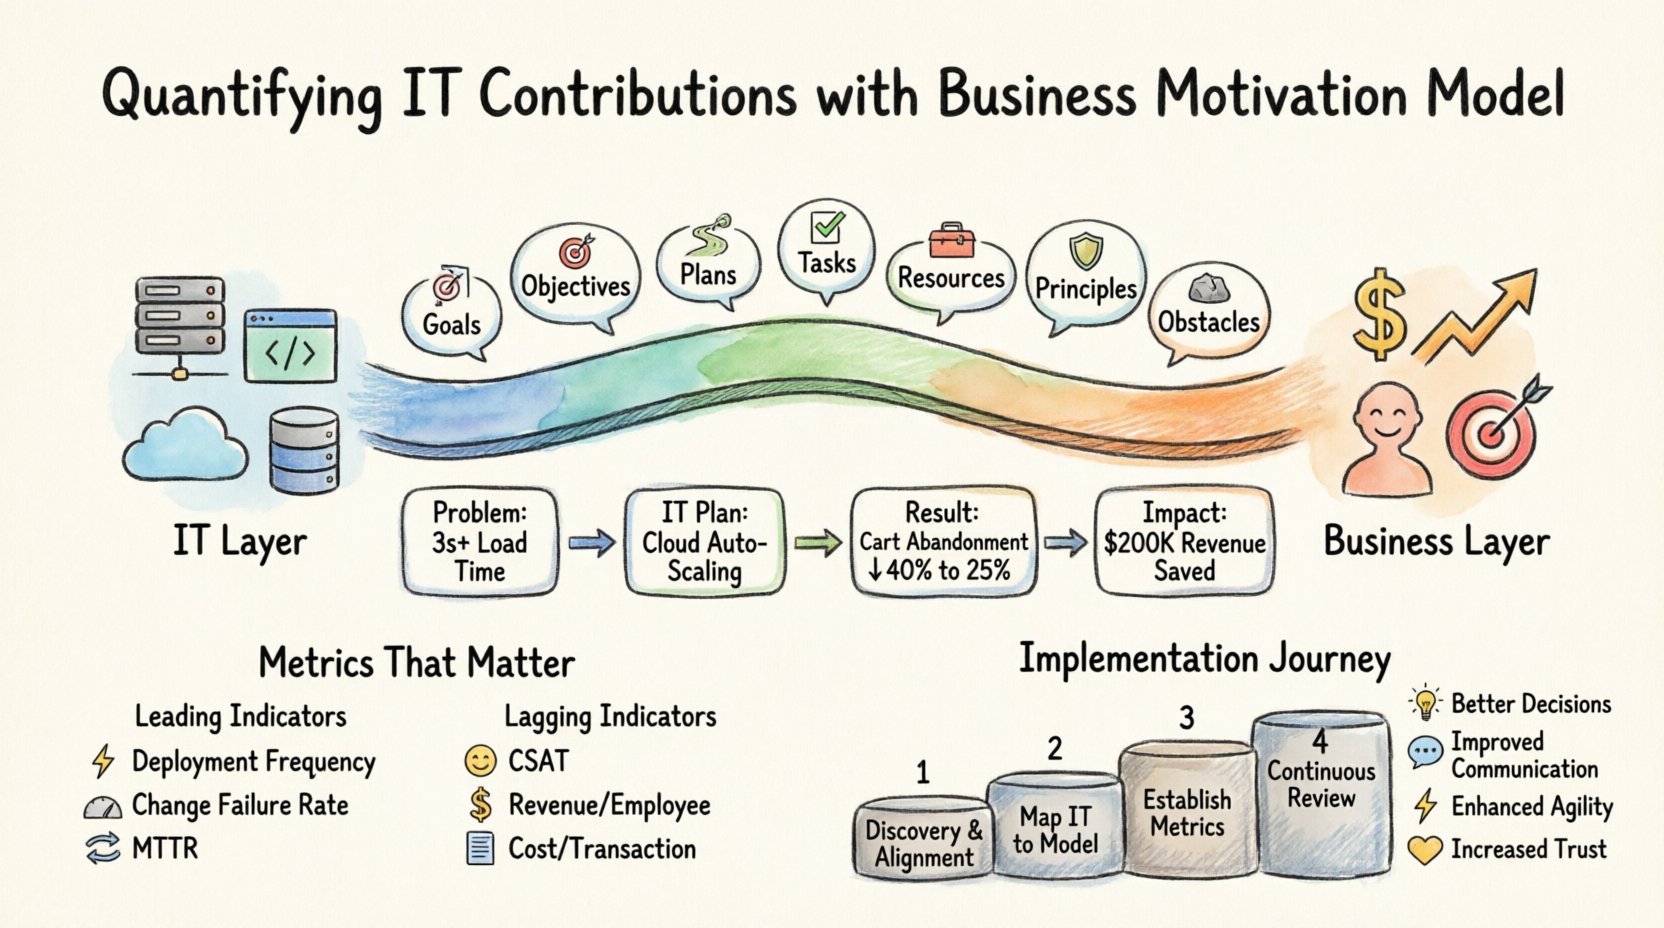
Consider a scenario where an e-commerce platform is experiencing slow load times. The business Goal is “Maximize Quarterly Revenue.” The Objective is “Minimize Cart Abandonment due to performance issues.” The Obstacle is “Server latency exceeding 3 seconds.” The IT Plan involves “Upgrading database infrastructure.” The Task is “Migrate to cloud-based auto-scaling.” The Resource is “Cloud compute budget.” The Principle is “Ensure 99.9% availability during peak hours.”
To quantify the contribution:
- Baseline: Measure cart abandonment rate before the change (e.g., 40%).
- Intervention: Execute the IT Plan.
- Result: Measure cart abandonment rate after the change (e.g., 25%).
- Calculation: Convert the reduction in abandonment to revenue saved.
This method transforms technical work into financial impact. It moves the conversation from “We spent $50,000 on infrastructure” to “We saved $200,000 in lost sales by optimizing infrastructure.” The BMM provides the structural logic to make this calculation credible and defensible to stakeholders.
📊 Defining Metrics That Matter
Not all metrics are created equal. Traditional IT metrics often focus on availability and speed. While important, they do not tell the whole story of business contribution. A robust measurement strategy requires a mix of leading and lagging indicators aligned with BMM elements.
Leading Indicators
Leading indicators predict future outcomes. They are useful for monitoring the health of the IT Plan.
- Deployment Frequency: Indicates agility in responding to business needs.
- Change Failure Rate: Measures stability and risk management.
- Mean Time to Recovery: Reflects resilience against Obstacles.
Lagging Indicators
Lagging indicators confirm past performance against Objectives.
- Customer Satisfaction Score (CSAT): Directly linked to the quality of IT services.
- Revenue per Employee: Shows how IT tools enable workforce productivity.
- Cost per Transaction: Demonstrates efficiency in processing business operations.
The Balanced Scorecard Approach
Using a balanced scorecard alongside BMM ensures that IT is not optimizing for one metric at the expense of others. For instance, cutting costs (financial perspective) should not degrade security (risk perspective). The BMM framework allows for the inclusion of multiple perspectives simultaneously.
| Dimension | BMM Element | Example Metric |
|---|---|---|
| Financial | Goal | Cost of IT as % of Total Revenue |
| Customer | Objective | Application Uptime during Business Hours |
| Internal Process | Plan | Time to Provision New Environments |
| Learning & Growth | Resource | Staff Certification Rate |
This alignment ensures that IT contributes to the holistic health of the organization, not just its technical stability.
🏢 Implementing the Model in Your Organization
Adopting the Business Motivation Model is a cultural shift, not just a technical exercise. It requires collaboration between business leaders, IT managers, and analysts. The implementation process should be phased to allow for adaptation and learning.
Phase 1: Discovery and Alignment
Begin by identifying the top-level Goals of the organization. Interview key stakeholders to understand their definition of success. Document the current Obstacles that prevent these goals from being met. At this stage, do not worry about technical details. Focus on the business narrative.
Phase 2: Mapping IT to the Model
Once the business goals are clear, map existing IT initiatives to them. Create a registry of IT Projects. For each project, define which BMM elements it supports. If a project cannot be linked to a Goal, flag it for review. This step often reveals redundant or low-value activities.
Phase 3: Establishing Metrics
Define the specific metrics required to measure the success of the linked initiatives. Ensure these metrics are accessible and trustworthy. Implement dashboards that visualize the connection between IT tasks and Business Goals. Transparency is key here; stakeholders should be able to see the value chain.
Phase 4: Continuous Review
The business environment changes. Goals shift, and Obstacles evolve. The BMM must be reviewed regularly. Schedule quarterly reviews to update the model. This ensures that IT remains aligned with the current business reality rather than a strategy from a year ago.
⚠️ Addressing Measurement Challenges
Implementing this framework is not without difficulties. Organizations often face specific hurdles when attempting to quantify IT contributions using BMM.
Data Silos
Business data and IT data often live in separate systems. Connecting a performance metric to a revenue metric requires data integration. Investing in data warehousing or API integrations is necessary to bridge this gap. Without clean data, the quantification effort loses credibility.
Cultural Resistance
IT teams may feel that being measured against business goals shifts the focus away from technical excellence. It is important to clarify that technical excellence is the means, not the end. The goal is better service delivery, which requires technical rigor. Communication is essential to prevent resentment.
Attribution Complexity
In large organizations, it is difficult to attribute a specific business outcome to a specific IT change. Multiple factors influence revenue. While perfect attribution is rare, the BMM helps establish correlation and contribution rather than demanding absolute proof for every dollar spent.
Resource Constraints
Defining and maintaining the model requires time and effort. If the organization lacks the manpower to maintain the BMM documentation, it will become obsolete. Start small. Focus on the most critical Goals first rather than trying to model the entire enterprise overnight.
🌱 Long-term Benefits of Strategic Alignment
Beyond immediate quantification, adopting the Business Motivation Model yields long-term strategic advantages. It fosters a culture of accountability and shared purpose.
- Better Decision Making: When IT proposals are evaluated against the BMM, decisions are based on value rather than preference. Projects that do not align with Goals are deprioritized.
- Improved Communication: A common vocabulary reduces misunderstandings between business and IT. Everyone understands what a “Goal” or “Obstacle” means in this context.
- Enhanced Agility: By understanding the drivers, IT can pivot faster when business priorities change. The model highlights what is critical, allowing for quick reallocation of resources.
- Increased Trust: When IT can demonstrate a clear line of sight to business outcomes, trust from leadership increases. This leads to better budget allocation and strategic partnership.
The journey toward quantifying IT contributions is ongoing. It requires patience and persistence. However, the payoff is a more integrated organization where technology is recognized as a core driver of success rather than a back-office utility.
By leveraging the Business Motivation Model, organizations can move beyond vague assertions of value to concrete, measurable evidence. This shift empowers IT leaders to advocate effectively for their teams and ensures that technology investments deliver the intended business results. The framework provides the structure needed to turn technical effort into business momentum.
Ultimately, the goal is not just to measure IT, but to optimize it. By understanding the motivations behind every task, every plan, and every resource, the organization can ensure that every action taken by the technology team moves the needle toward the defined success of the enterprise. This alignment is the foundation of a resilient and competitive modern business.

