In the landscape of software development, clarity is currency. Architects and developers rely on visual models to understand complex systems. Among Unified Modeling Language (UML) specifications, the Class Diagram stands out as the backbone of object-oriented design. Traditionally, creating these diagrams required manual effort, often leading to documentation that lagged behind the code. The introduction of automated generation tools has shifted this paradigm. This guide examines the technical realities, benefits, and limitations of generating UML Class Diagrams automatically.
Understanding the trade-offs is essential for maintaining architectural integrity. While automation accelerates documentation, it does not replace design thinking. This article explores the mechanics of code-to-diagram conversion, the fidelity of the output, and how teams can integrate these tools into existing workflows without compromising quality.
Defining Automated UML Generation 🛠️
Automated UML generation refers to the process where software tools extract structural information directly from source code to render a visual representation. Instead of drawing boxes and lines manually, the tool parses the codebase, identifies classes, interfaces, and inheritance hierarchies, and maps them to UML symbols.
This process relies on static analysis. The tool reads the Abstract Syntax Tree (AST) of the programming language. It does not execute the code but inspects the definitions. This distinction is critical. The diagram reflects the static structure, not the runtime behavior. For example, it shows that Class A extends Class B, but it does not show the dynamic state of an instance of A during a specific operation.
The primary goal is to bridge the gap between implementation and documentation. In many projects, documentation becomes obsolete shortly after release. Automated generation aims to keep the model synchronized with the source code, reducing the maintenance burden associated with keeping diagrams up to date.
Mechanisms: Forward vs. Reverse Engineering 🔄
Automated generation generally falls into two categories based on the direction of the workflow. Understanding the difference helps teams decide which approach fits their project lifecycle.
1. Forward Engineering (Code to Diagram)
Forward engineering involves taking existing code and producing a diagram. This is the most common form of automation. It is typically used for:
- Onboarding: New developers need to understand the codebase quickly.
- Refactoring: Architects visualize the impact of structural changes before applying them.
- Legacy Systems: Projects without documentation require immediate visualization to begin maintenance.
The tool scans the repository, identifies class definitions, and constructs the graph. It maps methods and attributes based on visibility modifiers (public, private, protected). However, it relies on the code being well-structured. If variable names are obscure, the diagram will reflect that obscurity.
2. Reverse Engineering (Diagram to Code)
Reverse engineering takes a visual model and generates code skeletons. While less common in modern agile environments, it serves specific purposes:
- Prototyping: Designing the structure before writing implementation logic.
- Standardization: Ensuring new code adheres to established architectural patterns.
- Migration: Converting designs from one language to another.
This approach requires the tool to interpret the diagram’s intent. Ambiguities in the visual model can lead to generic code stubs that require significant manual refinement. It is a starting point, not a finished product.
The Advantages of Automation 📈
Why do teams invest in these tools? The benefits are tangible and often drive efficiency gains. The primary value lies in synchronization and visibility.
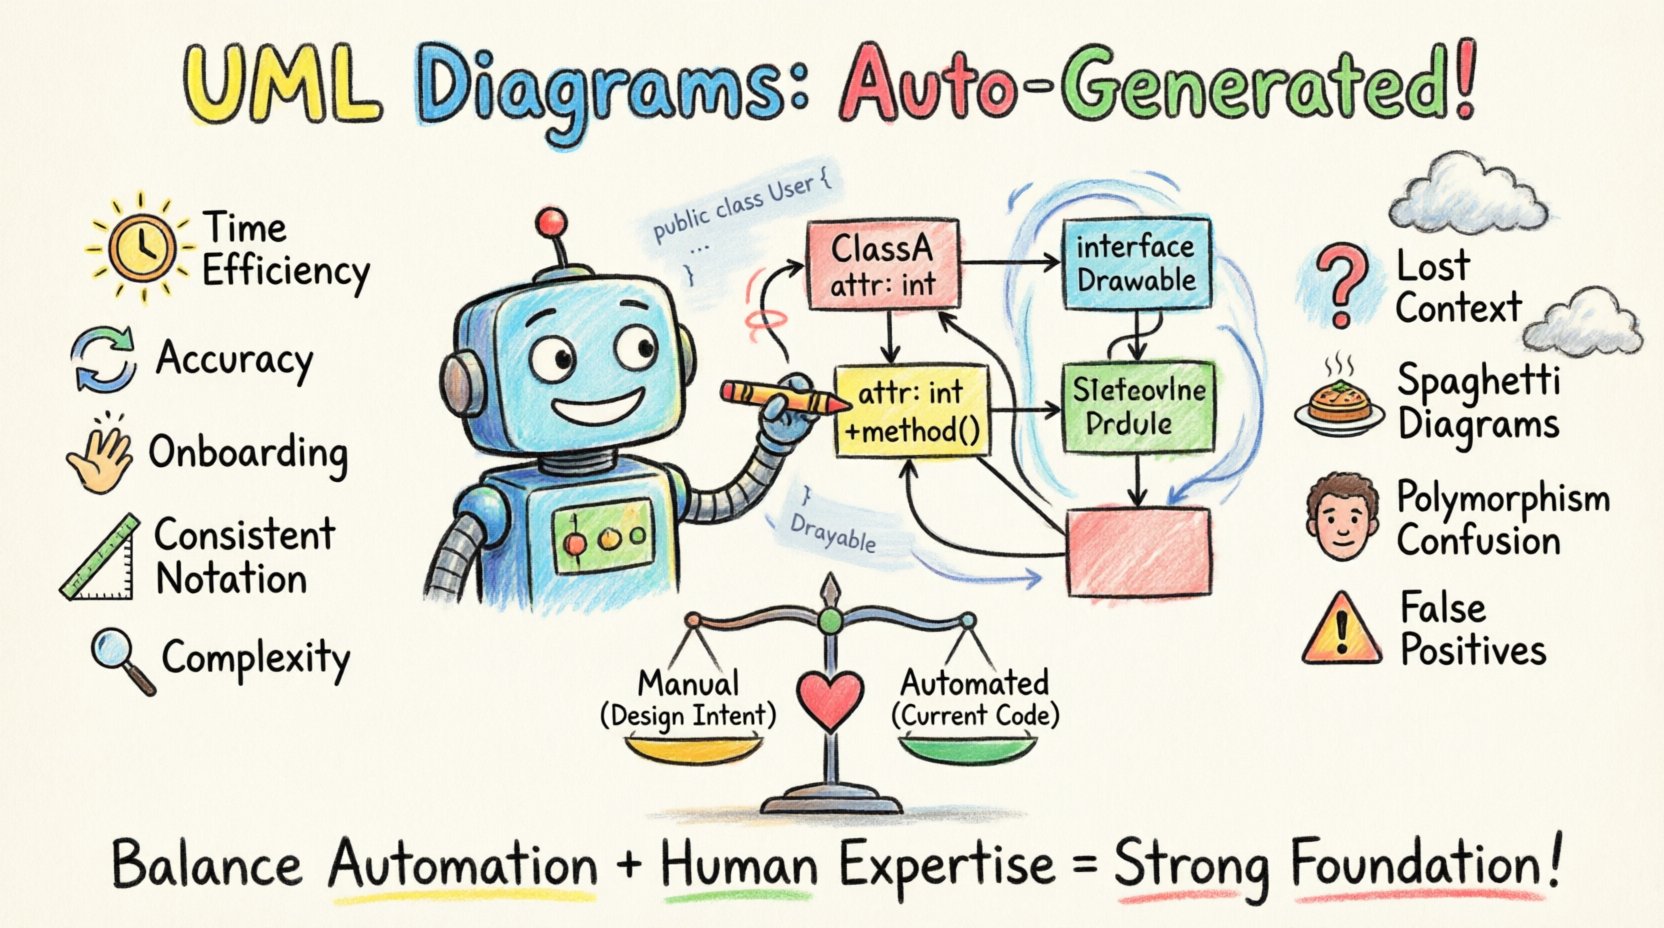
- Time Efficiency: Manually drawing a diagram for a large enterprise application can take weeks. Automated tools generate the initial draft in minutes. This allows architects to focus on high-level design rather than drawing rectangles.
- Accuracy and Synchronization: Manual diagrams drift. When a developer adds a method, the diagram does not update until someone remembers to change it. Automated tools reflect the current state of the repository. This reduces the risk of making decisions based on outdated information.
- Onboarding Acceleration: Visualizing the dependency graph helps new hires grasp the system topology. It highlights complex coupling that might be hidden in deep directory structures.
- Consistency in Notation: Tools enforce standard UML conventions. There is no variation in how inheritance is drawn or how associations are labeled. This creates a unified language for the team.
- Identification of Complexity: Tools often calculate metrics alongside the diagram, such as cyclomatic complexity or coupling depth. These metrics highlight classes that are too large or too dependent on others.
The Challenges and Limitations 📉
Despite the benefits, automation is not a silver bullet. There are significant technical and practical constraints that teams must acknowledge to avoid frustration.
- Loss of Semantic Context: Code contains logic, but diagrams show structure. A diagram cannot explain why a class exists or the specific business rules it enforces. The nuance of the implementation is lost in the abstraction.
- Interface vs. Implementation: Automated tools often struggle to distinguish between the contract (interface) and the realization (implementation). They may show all methods, cluttering the view with boilerplate code that does not contribute to the architectural understanding.
- Handling Polymorphism: Dynamic typing and runtime polymorphism are difficult to represent statically. A diagram might show a parent class, but the specific child class used in production depends on configuration or runtime conditions. The static view can be misleading.
- Dependency Resolution: In large monolithic systems, the diagram can become a “spaghetti” mess. If the tool does not filter views, a single screen might show thousands of classes and lines. This defeats the purpose of simplification.
- False Positives in Design: Tools cannot validate design patterns. They will draw a class as “singleton” if the code suggests it, but they cannot verify if the pattern was implemented correctly or if it is an anti-pattern.
- Version Control Drift: If the tool is not integrated into the build pipeline, the generated diagram might be outdated. Relying on a static file generated months ago is a risk.
Comparative Analysis: Manual vs. Automated ⚖️
To clarify the trade-offs, consider the following comparison of characteristics between traditional manual creation and automated generation.
| Feature | Manual Creation | Automated Generation |
|---|---|---|
| Speed | Slow (Hours/Days) | Fast (Minutes) |
| Accuracy | High (Intentional) | High (Current Code) |
| Maintenance | High Effort | Low Effort |
| Context | High (Design Intent) | Low (Structure Only) |
| Consistency | Variable (Human Error) | High (Tool Standard) |
| Cost | High (Labor) | Medium (Tooling) |
The table highlights that the choice is not binary. It is about balancing intent with reality. Manual diagrams capture the design. Automated diagrams capture the code.
Strategic Implementation in Workflows 🚀
Integrating automated generation requires a shift in process. It is not just a tool installation; it is a workflow change. To succeed, teams should consider the following strategies.
- Integration with CI/CD: The diagram generation process should be part of the continuous integration pipeline. Every time code is merged, the diagram should be regenerated. This ensures the artifact in the repository is always current.
- View Filtering: Do not dump the entire system into one view. Create filtered views based on subsystems, modules, or layers. This keeps the diagrams readable and focused on the relevant scope.
- Documentation Hygiene: Establish a rule that diagrams are generated artifacts. Do not manually edit the exported diagram files. If a change is needed in the model, update the code or the configuration, then regenerate. This prevents “shadow documentation” that diverges from reality.
- Selective Automation: Not every class needs to be in every diagram. Use annotations or configuration files to exclude test code, generated code, or utility libraries that add noise.
- Training: Ensure the team understands how to read the generated diagrams. Automated outputs can be dense. Developers need to know how to navigate the hierarchy and interpret the relationships.
Maintenance and Evolution Considerations 🧩
Even with automation, maintenance is required. The diagram is a reflection of the code, and the code evolves. Teams must manage the lifecycle of the visual model.
Code Rot: Over time, technical debt accumulates. Automated tools will faithfully document debt. If a class becomes overly complex, the diagram will show it. This can be used as a signal to refactor. The diagram becomes a diagnostic tool.
Versioning: When managing multiple versions of a system, diagrams should be versioned alongside the code. This allows teams to compare architectural changes over time. It helps answer questions like, “How did this module change over the last two releases?”
Integration with IDEs: Many modern environments offer real-time diagramming. This allows developers to see the impact of a change immediately. However, these are often local. For team-wide visibility, a central repository of generated diagrams is necessary.
Future Trends and AI Integration 🤖
The field is evolving. The next generation of tools is incorporating artificial intelligence to bridge the semantic gap.
- Natural Language Processing: Future tools may read code comments and commit messages to add context to the diagram. This could label relationships based on the logic described in the code, not just the syntax.
- Pattern Recognition: AI can identify design patterns automatically. Instead of just drawing a class, the tool could tag it as “Observer” or “Factory” based on the implementation.
- Predictive Analysis: Some platforms are beginning to suggest structural changes. If a diagram shows high coupling, the tool might suggest splitting a module.
These advancements promise to move beyond simple structural mapping to architectural intelligence. However, the core principle remains: the code is the source of truth.
Frequently Asked Questions ❓
Can automated tools handle microservices?
Yes, but with caveats. Microservices architecture involves multiple repositories. A tool must be configured to aggregate data across services. It can show inter-service dependencies, but it cannot show the internal logic of each service in a single view without significant configuration.
Is it better to document before or after coding?
For automated generation, the code comes first. You cannot generate a diagram from nothing. However, you can generate a diagram from a skeleton or stub code to visualize the intended structure before filling in the logic.
Does this replace the need for a software architect?
No. It replaces the need for a documentation drafter. The architect is still required to define the patterns, the constraints, and the business logic. The tool merely visualizes the result of those decisions.
How do I handle proprietary libraries?
Automated tools often struggle with closed-source libraries. They may treat them as black boxes. You can often configure the tool to treat specific package names as external dependencies, reducing the noise in the diagram.
What if the diagram is too large?
Use navigation and filtering. Most tools allow you to click a class to see its details, hiding the rest. Do not try to fit the entire enterprise architecture on one screen. Break it down by domain.
Final Thoughts 🏁
Automated generation of UML Class Diagrams is a powerful capability for modern software engineering. It solves the persistent problem of documentation drift and provides immediate visibility into system structure. However, it is not a substitute for thoughtful design.
Success depends on treating the diagram as a dynamic artifact derived from the code, rather than a static document to be maintained separately. When integrated correctly into the development lifecycle, these tools enhance collaboration and reduce cognitive load. They allow teams to focus on solving problems rather than drawing boxes.
The key is balance. Use automation for the structure, and use human expertise for the intent. Together, they create a robust architectural foundation that supports growth and change.

