


Introduction
In the realm of software architecture and system design, visualization is paramount. Two prominent approaches have emerged to help teams understand and communicate complex systems: Data Flow Diagram (DFD) Top-Down Decomposition and the C4 Model. While both serve the critical purpose of making systems comprehensible, they stem from fundamentally different philosophies and serve different audiences.
Think of DFDs as a subway map—they show you the routes data takes through the system, focusing on the journey of information. The C4 model, by contrast, is like Google Maps—it allows you to zoom in and out from a continent-level view down to street-level details, revealing the structural layers of your software.
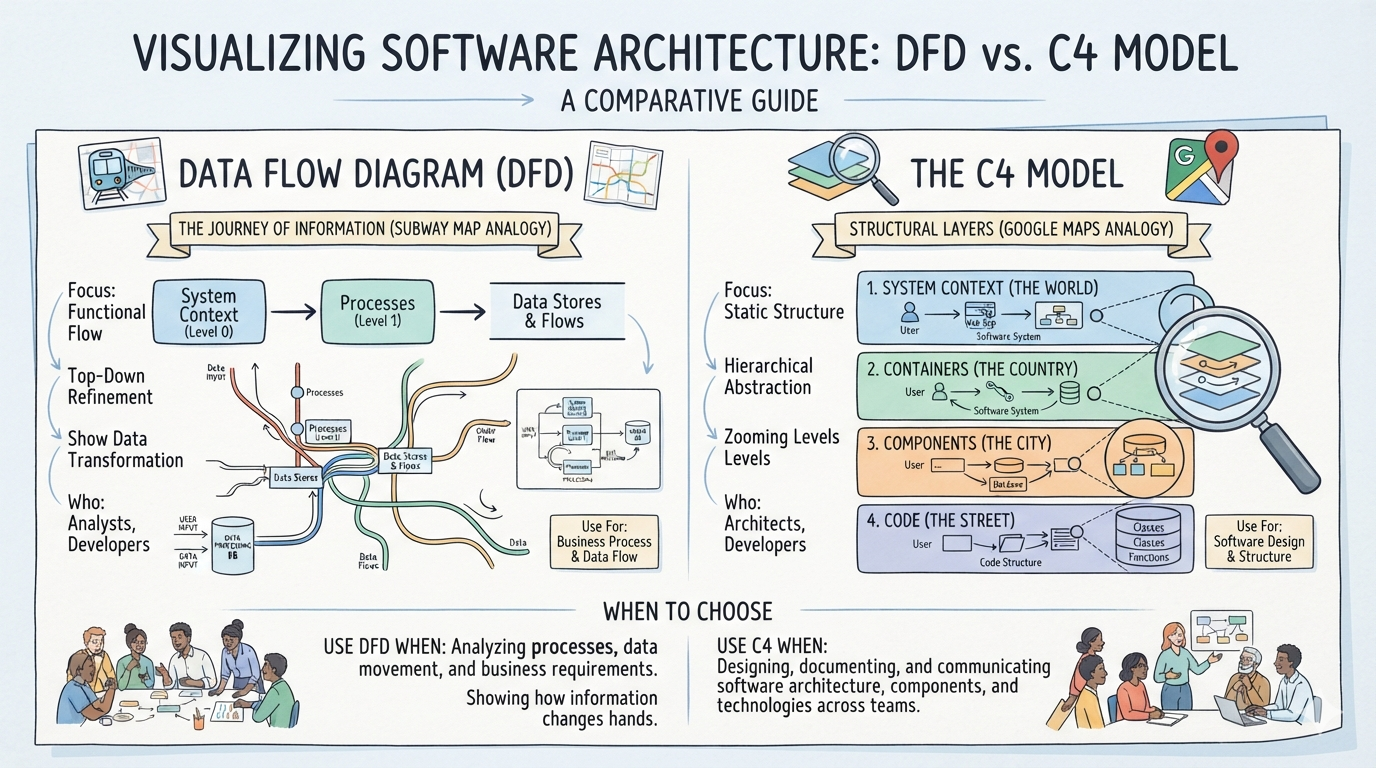
This guide will explore both approaches in depth, provide concrete examples, and help you understand when to use each.
Part 1: DFD Top-Down Decomposition
Core Philosophy
Structured analysis, the methodology behind DFDs, is a process-oriented approach. The fundamental principle is to define what a system should do before deciding how it should do it. The technique focuses on decomposing behaviors functionally—breaking a large, complex problem down into smaller, more manageable chunks.
The key question DFD answers: “How does data flow through the system?”
The Top-Down Decomposition Technique
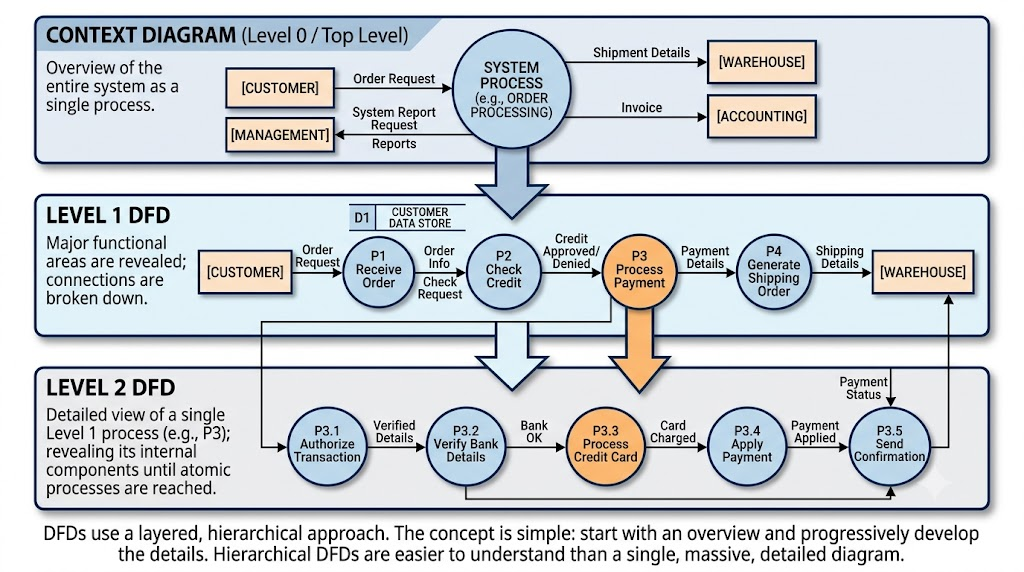
DFDs use a layered, hierarchical approach. The concept is simple: start with an overview and progressively develop the details. Hierarchical DFDs are easier to understand than a single, massive, detailed diagram.
DFD Levels Explained
Level 0 – Context Diagram (Top Level)
The highest-level DFD contains a single process representing the entire system. It shows:
-
The system as a single “black box”
-
External entities (users, other systems)
-
Input data flows (what goes in)
-
Output data flows (what comes out)
This defines the system’s scope and its data exchange relationships with the outside world.
Level 1 – Major Processes
The context diagram is “opened up” to reveal the major processes within the system. Each major function becomes a process bubble with its own inputs and outputs. Data stores (databases, files) appear at this level.
Level 2 and Beyond – Sub-Processes
Each Level 1 process can be further decomposed into sub-processes. This continues until processes become “atomic”—simple enough that they cannot or should not be decomposed further. Numbering conventions (1, 1.1, 1.1.1, etc.) track the hierarchy.
The Balancing Rule
A critical constraint of DFD top-down decomposition is balancing: the inputs and outputs must be conserved between levels. Level n and Level n+1 must have identical inputs and outputs.
For example, if Process 1 at Level 1 has inputs A and B and output C, its decomposition at Level 2 must show exactly the same inputs (A, B) and output (C), just distributed among sub-processes.
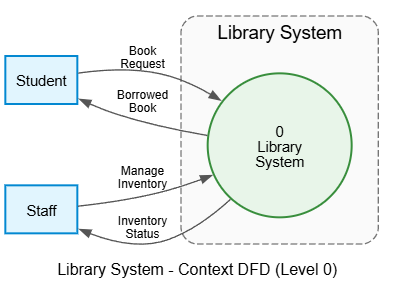
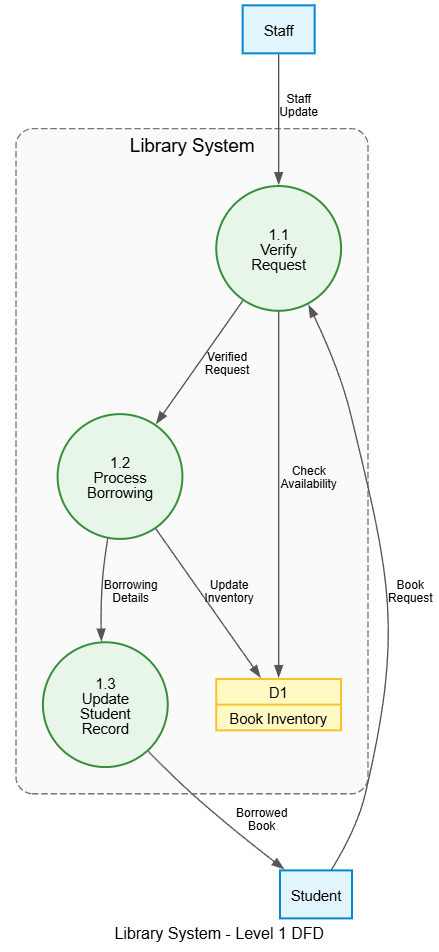
DFD Example: Library Management System
Context Diagram (Level 0):
Level 1 DFD:
When to Use DFDs
DFDs are particularly effective for:
-
Understanding legacy systems: When you need to understand how data flows through an existing system
-
Process-oriented scenarios: When the primary concern is what happens to data, not where code lives
-
Threat modeling: DFDs are commonly used to identify data flows that need security analysis
-
Business process analysis: When bridging the gap between business requirements and technical implementation
Part 2: C4 Model
Core Philosophy
The C4 model takes an abstraction-first approach to diagramming software architecture. It reflects how software architects and developers think about and build software. Rather than focusing on data flow, C4 reveals the structural layers of a system—who uses it, what its major components are, and how they’re built.
The key question C4 answers: “What are the parts of the system, and how do they fit together?”
The Four Levels
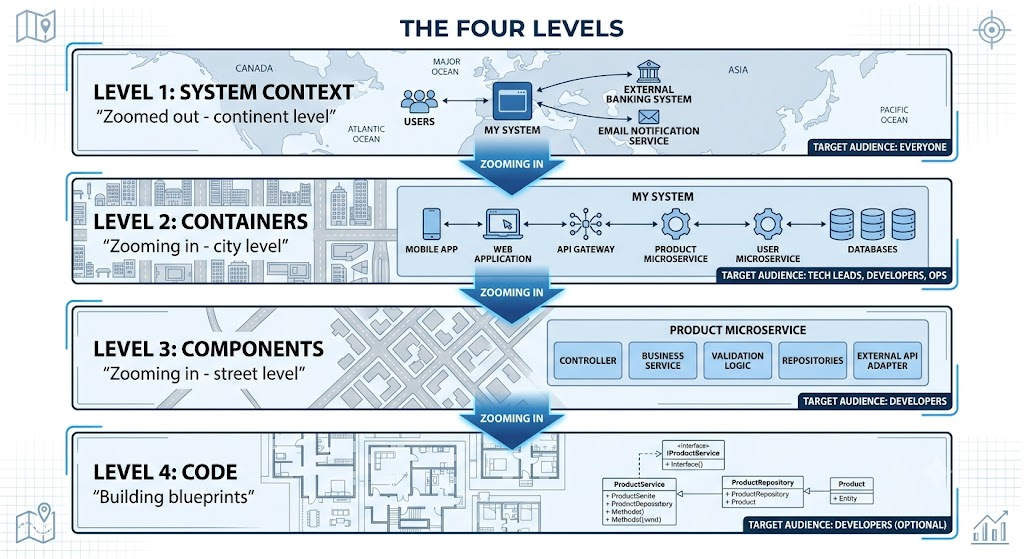
The C4 model is built around a simple analogy: zooming in on a map.
C4 Levels Explained
Level 1: System Context
This is the 30,000-foot view—the most zoomed out perspective. It shows:
-
Your system in the center
-
The users who interact with it (actors)
-
Other external systems it depends on
-
The high-level interactions between them
This diagram is for everyone: stakeholders, product managers, developers, and non-technical team members. It defines the scope of the project and the problem being solved.
Level 2: Containers
This level zooms into the system to show its high-level technical architecture. A “container” is not a Docker container—it’s any independently deployable unit:
-
Web applications (SPAs, mobile apps)
-
Web servers and APIs
-
Databases
-
Serverless functions
-
Message buses
-
Microservices
This level reveals technology choices and communication patterns between containers.
Level 3: Components
Zooming further into a single container, the component diagram reveals the major structural building blocks within that container. Components represent logical groupings of code:
-
Controllers (handling HTTP requests)
-
Service classes (business logic)
-
Repository classes (data access)
-
Adapters and gateways
This is comparable to a UML component diagram but with less strict rules.
Level 4: Code
The deepest level, showing how code of a single component is implemented. This is typically represented with UML class diagrams or entity relationship diagrams. While this level exists in the model, it’s often omitted because the code itself provides this information.
C4 Model Example: ChatGPT System
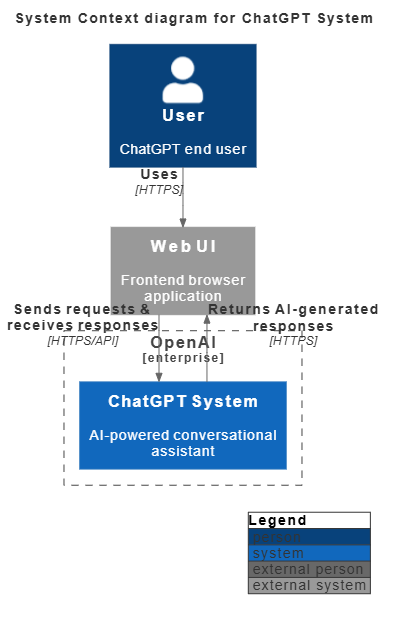
Level 1: System Context
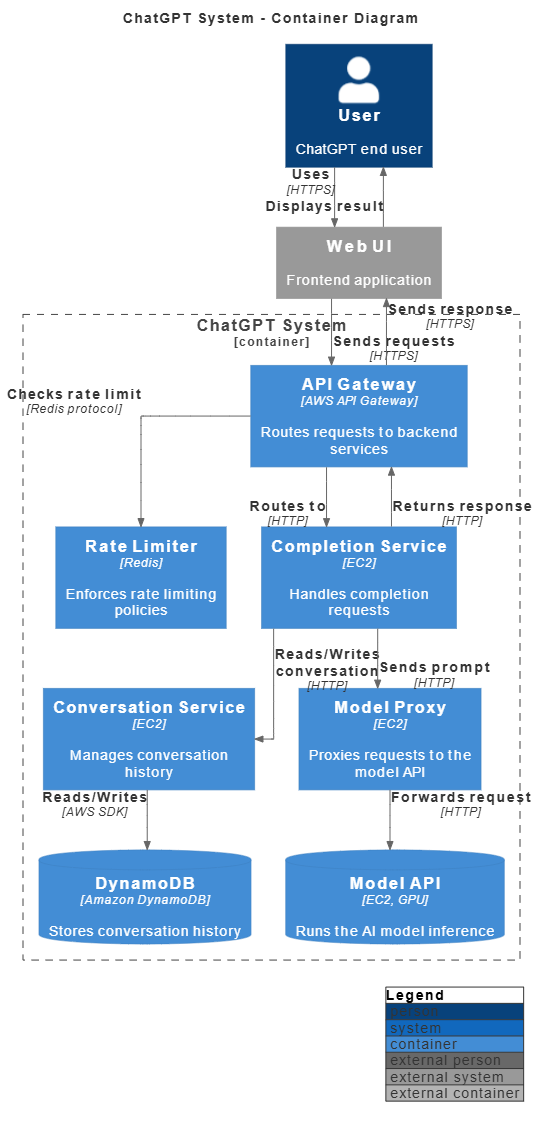
Level 2: Containers (Architecture Overview)
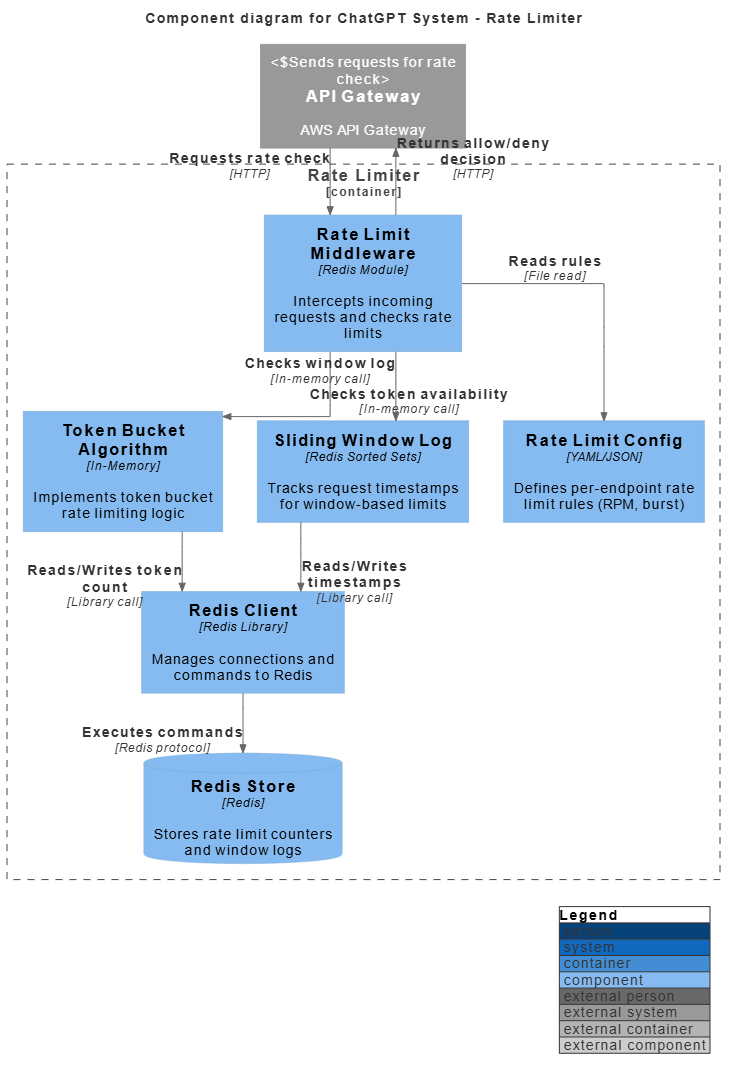
Level 3: Components (Completion Service internals)
When to Use C4 Model
The C4 model excels in modern software development scenarios:
-
Greenfield projects: When designing new systems with clear architectural layers
-
Microservices architectures: Where the container level maps naturally to services
-
Onboarding new developers: Providing a zoomable map of the codebase
-
Communicating with stakeholders: The context diagram is accessible to non-technical audiences
-
Documentation: C4 creates a living, layered documentation system
Part 3: Head-to-Head Comparison
Conceptual Comparison
| Aspect | DFD Top-Down Decomposition | C4 Model |
|---|---|---|
| Primary Focus | Data flow and transformation | Software architecture structure |
| Core Question | “How does data move through the system?” | “What are the system’s parts and how do they fit together?” |
| Decomposition Basis | Functional (processes broken into sub-processes) | Structural (systems broken into containers, components, classes) |
| Abstraction Approach | Vertical levels revealing process detail | Horizontal layers revealing architectural detail |
| Analogy | Subway map (routes of data) | Google Maps (zoom levels for structure) |
| Origin Era | 1970s-80s (structured analysis) | 2010s (modern software architecture) |
Level Structure Comparison
| DFD Level | What it Shows | C4 Level | What it Shows |
|---|---|---|---|
| Context (Level 0) | System as a black box with external entities | Level 1: Context | System with users and external systems |
| Level 1 | Major processes and data stores | Level 2: Containers | Deployable units (apps, databases, APIs) |
| Level 2+ | Sub-processes of each major process | Level 3: Components | Code groupings inside containers |
| Atomic processes | Simplest, undecomposable processes | Level 4: Code | Classes and interfaces |
Key Distinctions
1. Decomposition Logic
DFD breaks things down functionally. Process 1.1 and 1.2 are sub-functions of a larger process. C4 breaks things down structurally. A container contains components, which contain classes.
2. Audience Handling
The C4 model explicitly addresses different audiences through its four levels—the context diagram for everyone, containers for technical leads, components for developers. DFD levels primarily serve to manage complexity for analysts and developers, with less explicit audience targeting.
3. Technology Awareness
C4 encourages noting technologies at each level (e.g., “Redis for rate limiting,” “EC2 with GPUs for inference”). DFDs are largely technology-agnostic, showing what happens without specifying how.
4. Balancing vs. Consistency
DFDs require strict balancing between levels—inputs and outputs must be identical across levels. C4 has no such formal balancing requirement; diagrams simply zoom in or out, with relationships clearly indicated at each level.
Real-World Perspective
One practitioner notes that in the context of threat modeling, “the important point is to be consistent within a single DFD, and capture processes at the same ‘level’… If you haven’t come across the C4 Model then that will be helpful as it explains in greater detail what (it thinks) are sensible different levels to use”.
The C4 model is increasingly seen as an evolution that “was created as a way to help software development teams describe and communicate software architecture,” reflecting the shift toward more structural, service-oriented thinking in modern development.
Part 4: Practical Guidance
When to Choose DFD Top-Down Decomposition
Choose DFDs when you need to:
-
Analyze data movement: Understanding how information transforms through a process
-
Document legacy systems: Especially where the logic is complex but the structure is known
-
Perform threat modeling: DFDs remain a standard for identifying security-relevant data flows
-
Bridge business and IT: When business analysts need to show process flows to stakeholders
-
Model batch processing or ETL pipelines: Where data transformation is the core concern
When to Choose C4 Model
Choose C4 when you need to:
-
Design modern architectures: Microservices, cloud-native, or event-driven systems
-
Onboard new team members: The zoomable model provides an excellent learning path
-
Communicate with diverse audiences: From executives (context) to developers (code)
-
Create living documentation: C4 diagrams can be versioned and maintained alongside code
-
Clarify boundaries: In complex systems with multiple applications and services
Hybrid Approach
You don’t necessarily have to choose one or the other. Many teams use both:
-
Use C4 for the overall architecture story—what the system is and how it’s structured
-
Use DFDs within components to show complex data flows or business logic
As one practitioner suggests, “Depending on your project and the containers or components you need to describe, you’ll end up having a set of four or more diagrams that represent your C4 model”. At the component level, visualizing data flow can be extremely useful.
Practical Consideration: Tooling
For DFDs:
-
Visual Paradigm (supports DFD with balancing checks)
-
Visual Paradigm Online (general diagramming)
-
Microsoft Visio
For C4 Model:
-
IcePanel (built specifically for C4, supports flows and rich annotations)
-
Structurizr (official C4 tool)
-
Gliffy (with C4 support)
-
Draw.io with C4 stencils
Tooling: Visual Paradigm
Visual Paradigm provides a comprehensive Data Flow Diagram (DFD) suite that bridges traditional, model-based system analysis with modern, generative AI diagramming.
The ecosystem features two primary mapping pathways: a traditional, robust Visual Paradigm DFD Tool and a newly introduced text-to-diagram AI DFD Generator.
Traditional DFD Tool Key Features
-
Multi-Level Hierarchical Decomposition: Supports layered system modeling. You can easily drill down from a high-level Level-0 Context Diagram to specialized Level-1, Level-2, or lower child diagrams.
-
Model-Based Reusability: Elements like external entities, processes, and data stores are stored as reusable model components. Modifications to an asset update automatically across all diagram instances.
-
Resource Catalog: Features a rapid-drawing interface. Dragging a connector out from any element prompts an automated contextual menu to instantly select and link the next shape.
AI DFD Generator Features
-
Instant Text-to-Diagram Generation: Converts plain-text system descriptions into structured, fully complete Data Flow Diagrams via the native Visual Paradigm AI Chatbot.
-
Native Editability: The AI outputs native, model-based objects directly inside the editor canvas—not a flat static image—enabling ongoing manual refining, component movement, or project nesting.
-
Notation Flexibility: Dynamically renders and formats data structures according to industry-standard visual palettes, explicitly adapting to Yourdon & Coad, Yourdon DeMarco, or Gane-Sarson notation syntax.
-
Advanced Visual Optimization: Applies built-in mathematical routing paradigms (splines = true and overlap = false) to eliminate crossing data lines, clear visual ambiguity, and bundle internal transformations within styled System Boundary Containers.
Core DFD Symbol Mapping
Both traditional and AI engines map systems using the four critical DFD pillars:
| Component | Standard Purpose | Visual Paradigm Style |
|---|---|---|
| External Entities | Outside systems/actors providing or receiving data | Color-coded light-blue rectangular boxes |
| Processes | Internal operations modifying and routing data | Centralized logical circles or rounded nodes |
| Data Stores | Repositories where information rests (databases/files) | Open-ended storage bars or files |
| Data Flows | Directed paths showing information tracking | Smart-routing direction arrows |
Conclusion
The choice between DFD top-down decomposition and the C4 model is not about finding a “winner”—it’s about selecting the right perspective for the right problem.
DFDs are your tool when you need to trace the journey of data through a system. They excel at process analysis, identifying data transformations, and uncovering security-relevant information flows. They answer the question: “What happens to the data?”
C4 Model is your tool when you need to understand and communicate a system’s structure. It excels at showing architectural layers, clarifying boundaries, and providing different views for different audiences. It answers the question: “What is the system made of?”
In modern software development—with its microservices, cloud deployments, and cross-functional teams—the C4 model’s focus on structural clarity and audience-specific views has made it increasingly popular. But DFDs remain powerful for process analysis, legacy system understanding, and threat modeling.
The most effective architects and developers know both, understand their strengths, and use each where it best serves the purpose of making complex systems understandable.