


Software architecture relies heavily on visual communication. Without clear diagrams, teams risk misalignment, technical debt, and ambiguous requirements. Two of the most common Unified Modeling Language (UML) artifacts are the Component Diagram and the Activity Diagram. While both serve critical roles in system design, they address fundamentally different aspects of software behavior and structure.
Selecting the wrong diagram type can lead to confusion. A component diagram will not explain how a process flows. An activity diagram will not show what modules exist. Understanding the distinction is vital for architects and developers aiming to produce precise documentation. This guide explores the nuances of both, helping you determine the right tool for your specific design challenge.
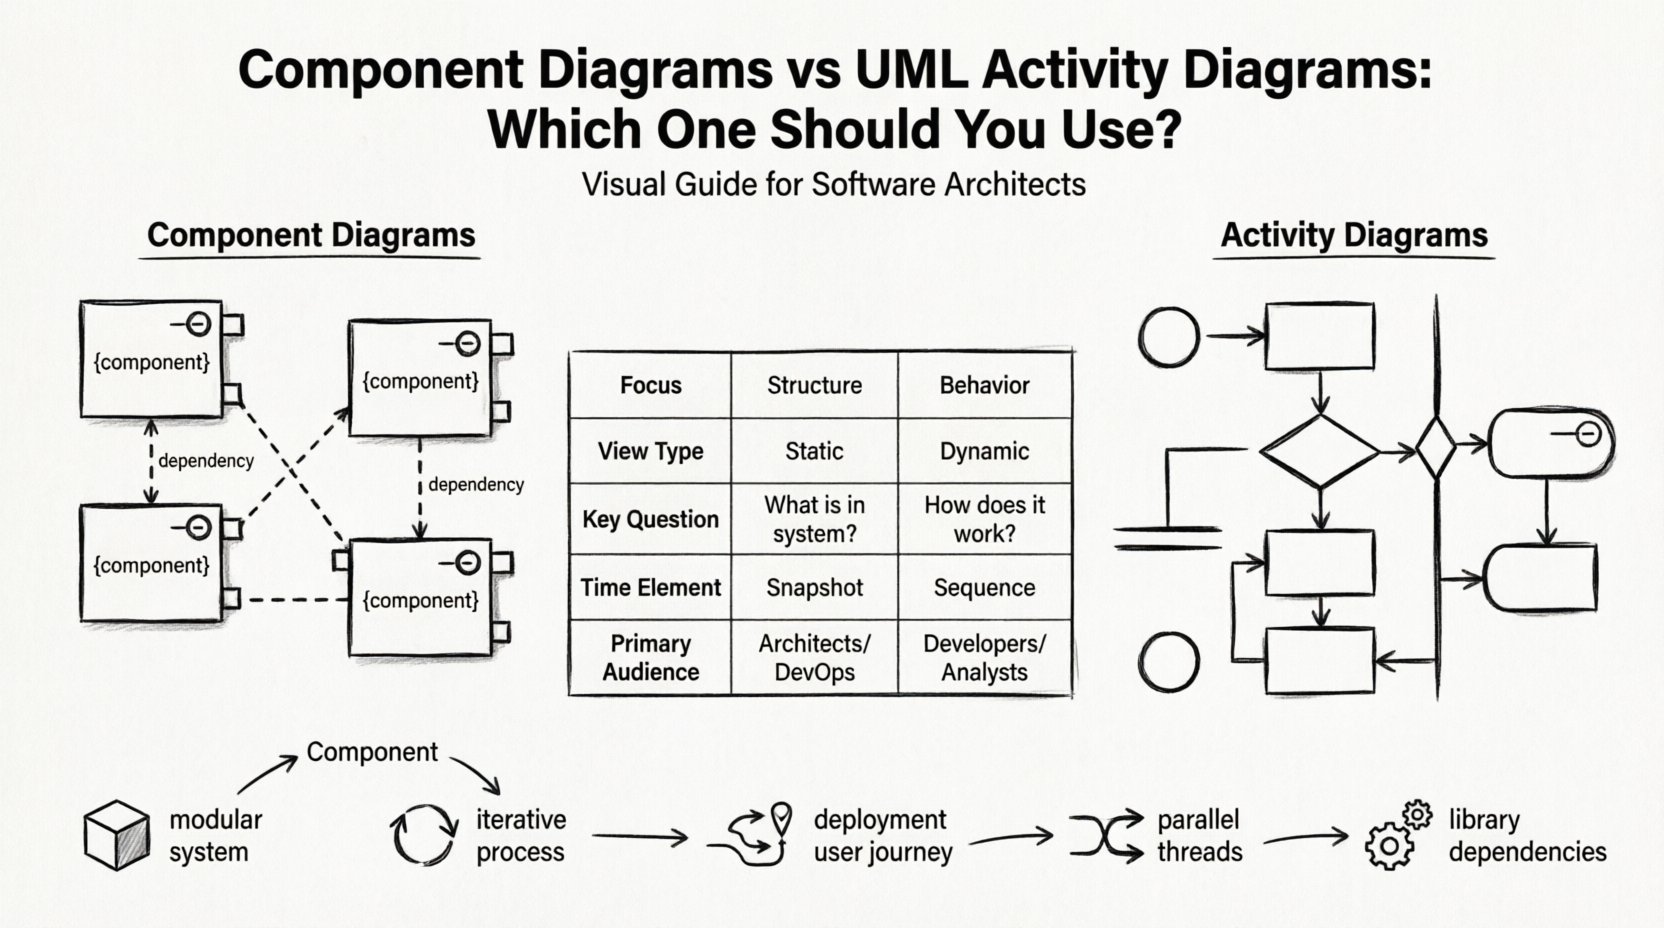
🧩 Understanding Component Diagrams
A component diagram represents the physical or logical structure of a system. It breaks down the software into manageable units called components. Think of it as the blueprint for the building blocks. It focuses on the static nature of the architecture.
Core Elements
To build an effective component diagram, you need to understand the fundamental symbols:
- Component Nodes: Represented as rectangles with the stereotype name
{component}or a specific library icon. These are the deployable units. - Interfaces: Defined as circles (provided) or lollipop shapes (required). They dictate how components interact without revealing internal implementation.
- Dependencies: Dashed lines indicating that one component relies on another to function. This could be a library link or an API contract.
- Ports: Specific points of interaction on a component where connections are made.
Primary Use Cases
When is a component diagram the best choice? It excels in scenarios where structure is the primary concern:
- High-Level Architecture: Visualizing the major subsystems of a large application.
- Dependency Management: Identifying circular dependencies or tight coupling between modules.
- Deployment Planning: Showing how components map to physical nodes or servers.
- Refactoring: Planning the reorganization of legacy code into distinct, testable units.
🔄 Understanding UML Activity Diagrams
If a component diagram is the skeleton, an activity diagram is the nervous system. It describes the dynamic behavior of a system. It focuses on the flow of control and data from one activity to another. It is essentially a flowchart enhanced with specific UML semantics.
Core Elements
Activity diagrams utilize a distinct set of notations to map logic:
- Initial Node: A solid circle indicating where the process begins.
- Activity States: Rounded rectangles representing specific actions or operations.
- Control Flow: Arrows connecting activities, defining the sequence of execution.
- Decision Nodes: Diamonds that split the flow based on boolean conditions (Yes/No).
- Fork and Join Nodes: Bars that represent parallel processing or synchronization points.
- Swimlanes: Horizontal or vertical partitions that assign responsibility to specific actors or systems.
Primary Use Cases
Activity diagrams are indispensable when behavior is the focus:
- Business Process Modeling: Mapping out a user journey or a workflow.
- Algorithm Logic: Detailing the steps of a complex calculation or data transformation.
- Concurrency: Showing how multiple threads or processes interact simultaneously.
- State Changes: Visualizing the lifecycle of an object during a specific operation.
🆚 Side-by-Side Comparison
Comparing these two models side-by-side clarifies their unique strengths. The following table highlights the technical distinctions.
| Feature | Component Diagram | Activity Diagram |
|---|---|---|
| Focus | Structure and Organization | Behavior and Flow |
| View Type | Static | Dynamic |
| Key Question | “What is in the system?” | “How does the system work?” |
| Time Element | None (Snapshot) | Time and Sequence |
| Primary Audience | Architects, DevOps | Developers, Business Analysts |
| Complexity | Dependencies and Interfaces | Logic and Decisions |
🧭 When to Use Component Diagrams
Choosing a component diagram requires a focus on modularity. Use this artifact when you need to communicate the boundaries of your software.
1. Defining Boundaries
In large-scale systems, teams often work on isolated modules. A component diagram clearly delineates where one module ends and another begins. This prevents scope creep and clarifies ownership.
- Identify shared libraries.
- Define API contracts between microservices.
- Clarify third-party dependencies.
2. Managing Coupling
Software quality often hinges on low coupling. Visualizing dependencies allows you to spot issues before coding begins. If Component A depends on Component B, and Component B depends on Component A, you have a cycle. Component diagrams make these cycles visible immediately.
3. Deployment Context
When moving from development to production, mapping components to infrastructure is necessary. This diagram type helps answer questions about containerization, server allocation, and network topology.
🧭 When to Use Activity Diagrams
Switch to an activity diagram when the complexity lies in the logic, not the structure.
1. Complex Workflows
Business processes often involve multiple steps, approvals, and conditional paths. Activity diagrams handle this complexity better than simple text. They show exactly what happens if a user clicks “Cancel” versus “Submit”.
2. Parallel Processes
Modern systems often handle multiple tasks at once. For example, a payment processing system might need to validate the credit card, check inventory, and update the database simultaneously. Activity diagrams use fork and join nodes to represent this concurrency clearly.
3. User Interaction Flows
For UI designers and UX researchers, activity diagrams provide a bridge between wireframes and code. They describe the sequence of events triggered by user input, including error handling and system responses.
🔗 Integrating Both Diagrams
These diagrams are not mutually exclusive. In fact, they are most powerful when used together. A robust architecture documentation strategy often pairs both.
The Component-Activity Relationship
Consider a system where a specific component is responsible for a complex workflow. You would use a component diagram to show that the component exists within the architecture. Then, you would use an activity diagram to detail the internal logic of that specific component.
Example Scenario: E-Commerce Checkout
- Component Diagram: Shows the
OrderService,PaymentGateway, andInventoryManagercomponents and their connections. - Activity Diagram: Details the steps inside the
OrderServicecomponent when a user clicks “Place Order”. It includes validation, inventory locking, and payment authorization.
This layered approach prevents information overload. Stakeholders interested in the overall system look at the components. Developers implementing specific features look at the activity flows.
⚠️ Common Mistakes to Avoid
Misusing these diagrams is a common pitfall. Avoid these errors to maintain clarity.
1. Mixing Concerns
Do not try to force a component diagram to show logic. Adding decision diamonds inside a component box confuses the static view. Keep behavior out of structure diagrams.
2. Over-Granularity
A component diagram listing every single class file is useless. Components should be meaningful units of deployment or logical grouping. If a component is just a single class, it is likely a class diagram, not a component diagram.
3. Ignoring Interfaces
In activity diagrams, failing to show input and output objects can obscure data flow. In component diagrams, hiding interfaces hides the dependencies. Always make connections explicit.
4. Static State in Dynamic Models
An activity diagram should not get stuck in one state. Ensure every path leads to a final node, or clearly indicate where the process waits. Dead ends in logic flow are confusing and unprofessional.
🛠️ Best Practices for Implementation
Adopting consistent standards improves the readability of your diagrams across the team.
1. Naming Conventions
- Use verbs for activity nodes (e.g., “Validate User”).
- Use nouns for component nodes (e.g., “Authentication Service”).
- Keep interface names consistent across all diagrams.
2. Color Coding
While color is not part of the UML standard, using it semantically in tools helps readability.
- Use red for error paths in activity diagrams.
- Use green for successful flows.
- Use grey for deprecated components.
3. Version Control
Diagrams change as the software evolves. Treat them as code. Store them in version control to track changes over time. This ensures that the documentation matches the deployed system.
4. Tool Independence
Focus on the semantics, not the tool. Whether you use a cloud-based whiteboard or a desktop modeling tool, the underlying logic remains the same. Ensure your diagrams can be exported or shared in a standard format like XML or SVG.
📊 Detailed Decision Matrix
Use this checklist to make a quick decision on which diagram to draft first.
- Is the system modular? ➔ Start with Component Diagram.
- Is the process iterative? ➔ Start with Activity Diagram.
- Are you planning deployment? ➔ Use Component Diagram.
- Are you designing a user journey? ➔ Use Activity Diagram.
- Do you need to show parallel threads? ➔ Use Activity Diagram.
- Do you need to show library dependencies? ➔ Use Component Diagram.
❓ Frequently Asked Questions
Can I use a sequence diagram instead?
Sequence diagrams focus on message passing between objects over time. They are more detailed than activity diagrams but less focused on high-level logic flow. If you need to see specific method calls, use a sequence diagram. If you need to see the overall process, use an activity diagram.
Are component diagrams only for backend systems?
No. They apply to any system with distinct modules. This includes frontend architectures, API gateways, and even hardware-software integrations.
How do I handle complex logic in activity diagrams?
Break it down. Use sub-processes. Instead of drawing one massive flow, create a node that links to a separate activity diagram for that specific sub-process. This keeps the main view clean.
What is the difference between a state machine diagram and an activity diagram?
A state machine diagram tracks the state of a single object over time (e.g., Order status: Pending -> Shipped). An activity diagram tracks the flow of actions across the whole system (e.g., The process of shipping an order).
Do I need to draw both for every project?
Not necessarily. For small scripts, a component diagram is unnecessary. For simple scripts, an activity diagram might be overkill. Choose the diagram that adds value to the communication of your specific team.
How do I document interfaces?
In component diagrams, list the interface names clearly. In activity diagrams, show data objects passing between nodes. Together, they define the contract between your modules.
📝 Final Thoughts on Modeling
The choice between a component diagram and an activity diagram is not about preference; it is about intent. One maps the terrain, the other maps the journey. By understanding the distinct capabilities of each, you ensure that your technical documentation serves its purpose accurately.
Remember that diagrams are living artifacts. They require maintenance. As your system evolves, update both the structural components and the behavioral flows. This discipline ensures that your documentation remains a reliable source of truth for your engineering team.
Start with the structure to define your boundaries. Then, define the behavior to guide your logic. This combination creates a comprehensive view of your software system, enabling better collaboration and fewer errors during development.

