


Designing software architecture is a complex task that requires clear communication between developers, stakeholders, and maintainers. One of the most effective ways to visualize the structural organization of a system is through a component diagram. This guide will walk you through the essential elements, relationships, and best practices needed to construct a robust component diagram for your projects. Whether you are planning a new application or documenting an existing system, understanding how to represent components and their interactions is crucial for maintaining clarity and efficiency.
What Is a Component Diagram? 🤔
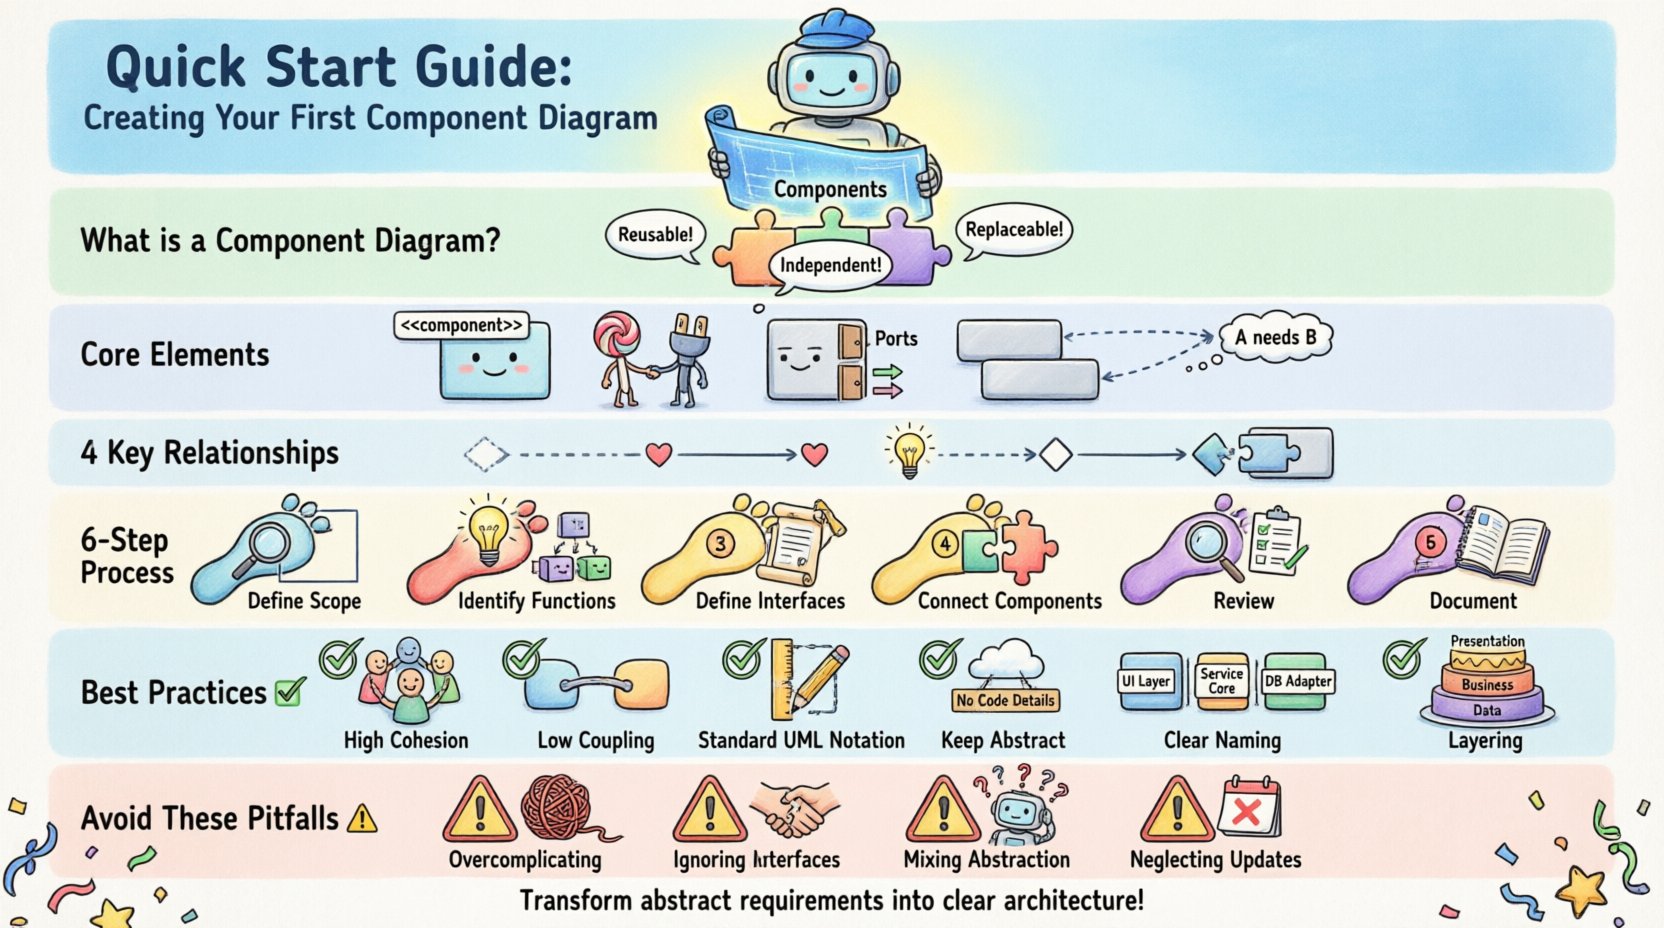
A component diagram is a type of structural diagram used in Unified Modeling Language (UML) to depict the organization and dependencies among a set of components. Unlike class diagrams that focus on individual classes, component diagrams operate at a higher level of abstraction. They represent the physical or logical building blocks of a software system. Think of a component as a modular unit that encapsulates functionality. These units are designed to be independent, reusable, and replaceable, which simplifies the overall architecture.
When you create a component diagram, you are essentially mapping out the system’s physical structure. This includes:
- Components: The modular units themselves, often represented as rectangles with the component stereotype.
- Interfaces: The contract a component exposes or requires to interact with others.
- Ports: Specific points where connections are made to interfaces.
- Dependencies: The relationships that show how components rely on one another.
This visual representation helps stakeholders understand how the system is assembled without getting bogged down in implementation details like code syntax or specific database schemas. It provides a blueprint for development and a map for maintenance.
Core Elements of a Component Diagram 🧩
To build an accurate diagram, you must first understand the fundamental building blocks. Each element serves a specific purpose in defining the system’s structure and behavior. Below is a breakdown of the primary symbols and their meanings.
1. Components ⬜
A component represents a modular part of a system. It encapsulates implementation details and exposes functionality through interfaces. In a diagram, this is typically drawn as a rectangle with the label “<<component>>” at the top. The body of the rectangle contains the name of the component. Examples might include a “Payment Service,” “User Authentication Module,” or “Database Access Layer.” Components can be physical, such as a compiled binary, or logical, such as a subsystem.
2. Interfaces 🎯
Interfaces define the contract for interaction. They specify what operations a component can perform or what services it needs from others. There are two main types of interfaces in this context:
- Provided Interfaces: Services that the component offers to the outside world. These are often depicted as a “lollipop” symbol attached to the component.
- Required Interfaces: Services that the component needs to function. These are often depicted as a “socket” symbol attached to the component.
Using interfaces allows components to communicate without knowing the internal details of each other. This promotes loose coupling, making the system easier to modify and scale.
3. Ports 🚪
Ports are specific interaction points on a component. While an interface defines the rules of engagement, a port defines the location where that engagement happens. A component can have multiple ports, allowing it to connect to different interfaces simultaneously. For example, a “Web Server” component might have one port for handling HTTP requests and another for managing database connections.
4. Dependencies 🔗
Dependencies illustrate the reliance of one component on another. If Component A depends on Component B, changes in B might affect A. Dependencies are typically shown as dashed lines with an open arrowhead pointing towards the dependent component. Understanding these lines is vital for impact analysis when refactoring code.
Understanding Relationships Between Components 🔄
The connections between components tell the story of how data and control flow through the system. Misinterpreting these relationships can lead to architectural flaws. It is important to distinguish between the different types of associations used in component modeling.
| Relationship Type | Description | Visual Representation |
|---|---|---|
| Dependency | A uses B. A change in B may impact A. | Dashed line with open arrow |
| Association | A structural link indicating a connection. | Solid line |
| Realization | One component implements the contract of another. | Dashed line with hollow triangle |
| Composition | Strong ownership; parts cannot exist without the whole. | Filled diamond on the whole side |
When designing your diagram, you should prioritize dependency relationships for logical connections and use interfaces to formalize the interaction points. Avoid cluttering the diagram with every single data flow; focus on the structural dependencies that define the architecture.
Step-by-Step Guide to Creating Your First Diagram 🛠️
Creating a component diagram is not just about drawing boxes; it is a process of analysis and design. Follow these steps to ensure your diagram is accurate and useful.
Step 1: Define the Scope and Boundaries 🚧
Before drawing anything, determine what system you are modeling. Are you documenting the entire enterprise application, or just a specific microservice? Defining the scope prevents the diagram from becoming overwhelming. Clearly mark the system boundary, often represented as a dashed rectangle enclosing all components within that specific system. This helps viewers understand what is inside your control and what is external.
Step 2: Identify Major Functionalities 🔍
Review the system requirements to identify the core functionalities. Group these functionalities into logical modules. For instance, if you are building an e-commerce platform, you might identify modules for “Product Catalog,” “Shopping Cart,” “Order Processing,” and “Payment Gateway.” These modules become your initial components. Ensure that each component has a single responsibility. A component that tries to do too much often leads to high coupling and low cohesion.
Step 3: Define Interfaces for Each Component 📝
Once you have your components, define how they interact. For each component, ask: What services does it provide? What services does it need? List the operations for each interface. For example, the “Payment Gateway” component provides an interface called “ProcessPayment.” The “Order Processing” component requires the “ProcessPayment” interface. Documenting these interfaces explicitly ensures that developers know exactly what is expected of each module.
Step 4: Establish Connections and Dependencies 🔗
Draw the lines connecting the components based on the interfaces defined in the previous step. Use the provided and required interface symbols to show where connections occur. If Component A needs the “ProcessPayment” interface, draw a line from Component A to the “ProcessPayment” interface on Component B. Label the lines if necessary to indicate the nature of the data being passed, such as “Credit Card Data” or “Order Status.” Keep the number of crossing lines to a minimum to maintain readability.
Step 5: Review for Consistency and Clarity 🧐
After the initial draft, review the diagram for errors. Check that all required interfaces are met. Ensure that there are no circular dependencies that could cause infinite loops or bootstrapping issues. Verify that naming conventions are consistent across all components and interfaces. Use clear, descriptive names that are understandable by both technical and non-technical stakeholders.
Step 6: Document the Design 📚
A diagram is only useful if it is understood. Add notes or annotations to explain complex relationships or specific design decisions. Document the version of the diagram and the date of creation. This ensures that the documentation remains relevant as the system evolves. Regular updates to the diagram are essential to maintain its value as a living document.
Best Practices for Component Modeling ✅
To create high-quality diagrams that stand the test of time, adhere to these established principles. These practices help maintain a clean architecture and facilitate better communication.
- Maintain High Cohesion: Group related functionalities together within a single component. If a component performs unrelated tasks, consider splitting it. High cohesion means the elements within a component work closely together to achieve a specific goal.
- Minimize Coupling: Reduce the number of dependencies between components. Use interfaces to decouple components so they do not rely on specific implementations. This allows you to swap out components without breaking the entire system.
- Use Standard Notation: Stick to standard UML symbols. Deviating from standards can confuse readers who are familiar with the conventions. Consistency in notation is key to clarity.
- Keep It Abstract: Do not include implementation details like variable names, method signatures, or database schemas. Focus on the logical structure. If you need those details, refer to class diagrams or technical specifications.
- Naming Conventions: Adopt a naming convention for components and interfaces. Use nouns for components (e.g., “User Manager”) and verbs or nouns for interfaces (e.g., “ManageUsers” or “UserRepository”). This reduces ambiguity.
- Layering: Organize components into layers such as Presentation, Business Logic, and Data Access. This helps visualize the flow of control and data from the user interface down to the storage layer.
Common Pitfalls to Avoid 🚫
Even experienced architects can make mistakes when creating component diagrams. Being aware of common errors can save you time and prevent confusion later in the development cycle.
Overcomplicating the Diagram
One of the most frequent mistakes is trying to include every single detail in the diagram. A component diagram should be a high-level overview. If you find yourself adding dozens of components, you may need to break the diagram into sub-diagrams for different subsystems. Clarity is more important than completeness at this stage.
Ignoring Interface Contracts
Some designers draw lines between components without defining the interfaces. This makes it unclear how the components interact. Always define the provided and required interfaces. This forces you to think about the contract of interaction, which is critical for integration.
Mixing Levels of Abstraction
Do not mix logical components with physical files or network nodes in the same diagram unless necessary. Keep the focus on the software architecture. Mixing physical deployment details with logical component structures can confuse the reader about what is being modeled.
Neglecting Changes
Architecture evolves. If you create a diagram and never update it, it becomes outdated quickly. Treat the diagram as part of the codebase. Update it whenever a component is added, removed, or significantly modified. An outdated diagram is worse than no diagram at all because it misleads developers.
Real-World Application Scenarios 🌍
Component diagrams are versatile tools used in various contexts throughout the software development lifecycle. Here are a few scenarios where they are particularly valuable.
System Integration
When integrating third-party systems, a component diagram helps visualize how your internal modules connect to external services. You can clearly show the adapter components required to bridge different protocols or data formats. This is essential for API integration projects.
Legacy Modernization
Refactoring legacy systems often requires understanding the existing structure. A component diagram of the current system helps identify tightly coupled modules that need to be decoupled. It serves as a map for the refactoring journey, guiding where to start and how to isolate dependencies.
Team Collaboration
Large development teams often work on different parts of the system simultaneously. A component diagram defines the boundaries between teams. Team A owns the “Order Service,” and Team B owns the “Inventory Service.” The interfaces between them define the agreement for collaboration, reducing merge conflicts and integration issues.
Advanced Considerations for Scalability 📈
As systems grow, the component diagram must evolve to handle complexity. Consider the following advanced strategies for larger projects.
- Subsystems: Use subsystems to group related components. A subsystem acts as a container for components, providing a higher level of abstraction. This helps manage complexity in large systems.
- Profiles and Extensions: If you need to model specific technologies, use profiles to extend the UML notation. This allows you to add tags or stereotypes relevant to your specific domain without breaking standard compliance.
- Deployment Views: While component diagrams show logical structure, deployment diagrams show physical nodes. Ensure your component diagrams align with your deployment strategy. A component should ideally map to a deployable artifact.
- Versioning: In microservices architectures, components often have versions. Indicate versioning in the interface definitions to ensure backward compatibility is maintained during updates.
Conclusion 🎓
Creating a component diagram is a fundamental skill for any software architect or developer. It transforms abstract requirements into a tangible structure that guides implementation and maintenance. By understanding the core elements, relationships, and best practices, you can produce diagrams that serve as effective communication tools. Remember to keep the diagrams clean, consistent, and up-to-date. A well-documented architecture reduces technical debt and facilitates long-term system health.
Start small with your next project. Identify the key modules, define their interfaces, and map the dependencies. As you gain experience, you will find that the process becomes intuitive. The effort invested in creating these diagrams pays dividends in reduced confusion and smoother development cycles. Use this guide as a foundation for your architectural documentation journey.

