Agile methodologies prioritize working software over comprehensive documentation. Yet, infrastructure remains a critical component of any software product. Deployment diagrams serve as a bridge between abstract requirements and physical reality. They map out hardware, software components, and their interconnections. In fast-paced environments, the question arises: when does this static artifact add value versus becoming a bottleneck?
This guide explores the strategic moments to leverage deployment diagrams within iterative workflows. It examines how these visualizations support communication, compliance, and stability without hindering speed.
📐 Understanding Deployment Diagrams
A deployment diagram represents the physical architecture of a system. Unlike a class diagram which shows logical structures, or a sequence diagram which shows interactions over time, this diagram focuses on the hardware nodes and software artifacts running on them.
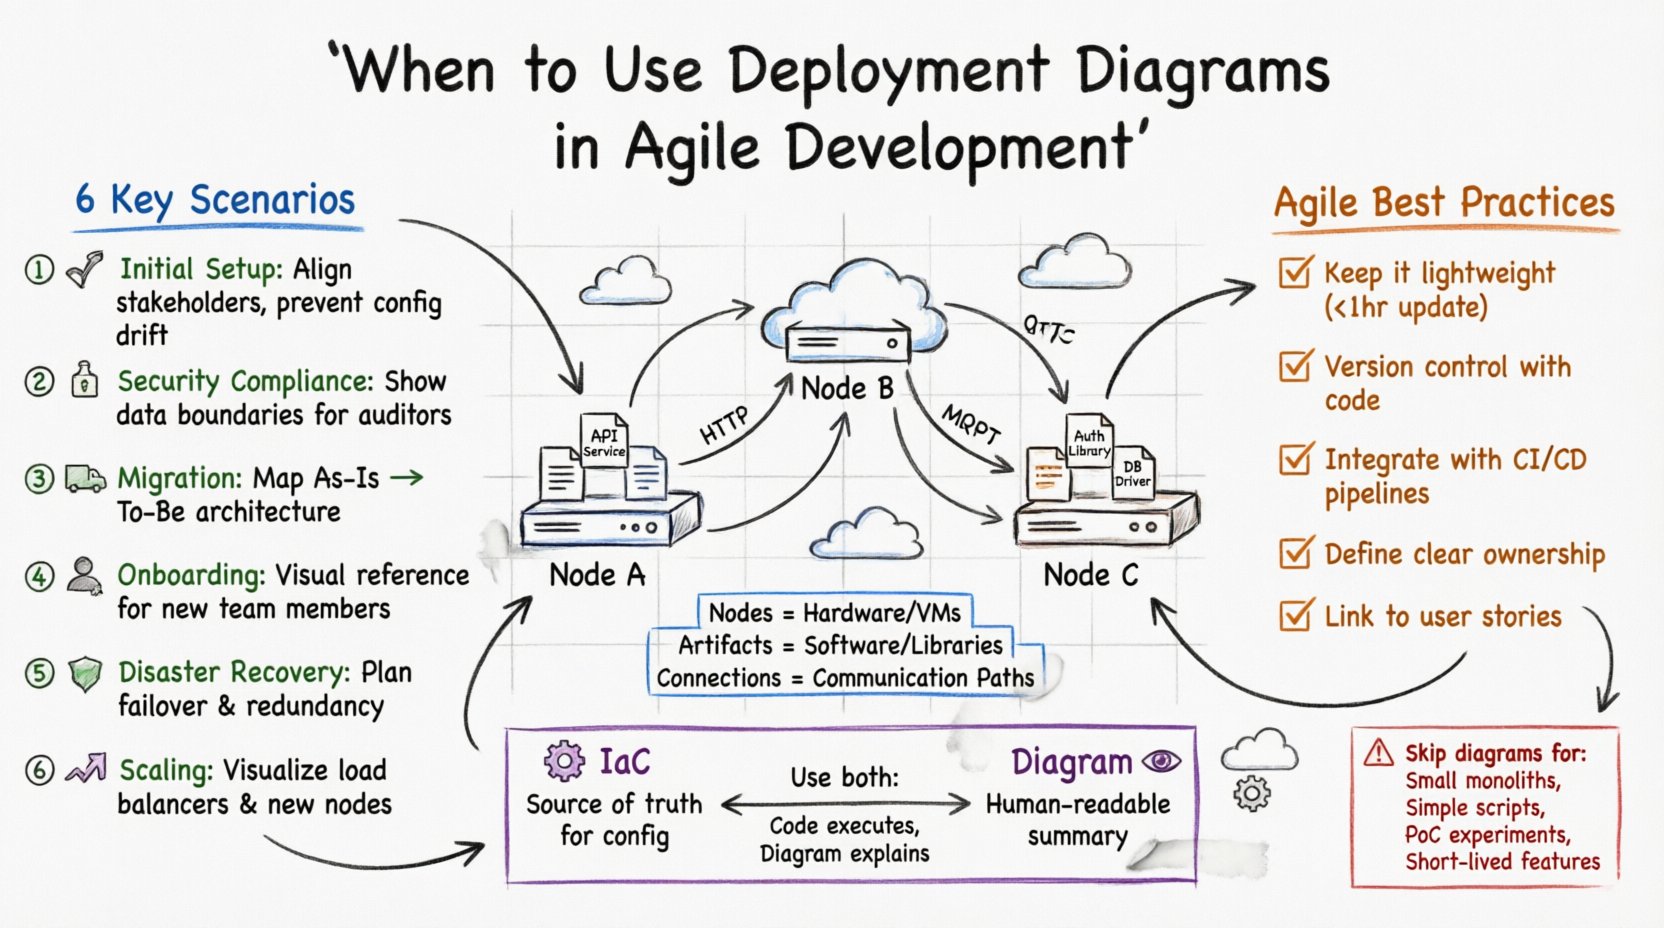
- Nodes: Represent physical hardware, servers, or virtual machines.
- Artifacts: Show software components, libraries, or executables deployed to the nodes.
- Connections: Depict communication paths between nodes and artifacts.
In an Agile context, the challenge lies in keeping these diagrams accurate as the system evolves. A diagram that is outdated immediately loses its value. Therefore, understanding when to create or update them is more important than the diagram itself.
🔄 The Agile Tension: Speed vs. Clarity
Agile frameworks encourage rapid iteration. Teams deliver small increments of value frequently. Heavy documentation is often seen as a waste. However, infrastructure complexity grows with every sprint. Without a clear map, changes can introduce unintended side effects.
The goal is not to document everything, but to document the right things at the right time. Deployment diagrams become essential when the mental model of the infrastructure diverges from reality or when multiple teams need a shared understanding of the environment.
🚩 Key Scenarios for Use
There are specific triggers where the value of a deployment diagram outweighs the cost of creation. Below are the primary scenarios where this artifact is justified.
1. Initial Infrastructure Setup 🏁
When a project begins, the team must define the baseline environment. This is the most critical time to create a high-level deployment diagram.
- Why: It aligns stakeholders on the target architecture.
- Benefit: Prevents configuration drift before the first line of code is written.
- Agile Fit: Define the skeleton during the initial sprint planning.
2. Security Audits and Compliance 🔒
Regulatory requirements often demand proof of data flow and network segmentation. A deployment diagram provides a clear view of where sensitive data resides.
- Why: Auditors need to see the physical boundaries of the system.
- Benefit: Demonstrates adherence to security policies regarding data isolation.
- Agile Fit: Update the diagram before release cycles that involve compliance checks.
3. Infrastructure Migration 🚚
Moving systems between cloud providers or on-premise to cloud requires careful planning. A diagram acts as the blueprint for the transition.
- Why: It highlights dependencies between services that must move together.
- Benefit: Reduces risk of breaking connections during the switch.
- Agile Fit: Create the “As-Is” and “To-Be” diagrams for the migration sprint.
4. Onboarding New Team Members 👥
New developers or DevOps engineers often struggle to visualize the system. Verbal explanations are insufficient for complex architectures.
- Why: It provides a visual reference for how components interact.
- Benefit: Reduces the time required to become productive.
- Agile Fit: Include the diagram in the initial documentation package for new hires.
5. Disaster Recovery Planning 🛡️
When planning for failures, teams need to know the redundancy levels of their infrastructure.
- Why: It shows where backups are stored and how failover occurs.
- Benefit: Clarifies recovery time objectives and data loss tolerance.
- Agile Fit: Review and update the diagram during risk assessment workshops.
6. Scaling Decisions 📈
As load increases, the architecture must evolve. Diagrams help plan for horizontal or vertical scaling.
- Why: It visualizes load balancers and additional nodes.
- Benefit: Ensures the infrastructure can handle anticipated traffic.
- Agile Fit: Update the diagram during capacity planning sessions.
📊 Frequency of Updates
Not all diagrams need to be updated every sprint. Some are stable, while others change frequently. The table below outlines recommended update frequencies based on scenario.
| Scenario | Frequency | Owner |
|---|---|---|
| Initial Setup | Once | System Architect |
| Security Compliance | Quarterly | Security Lead |
| Migration | Per Sprint | DevOps Engineer |
| Onboarding | Per Hire | Team Lead |
| Disaster Recovery | Annually | Infrastructure Team |
| Scaling | Per Major Release | Performance Engineer |
🛠️ Best Practices for Agile Integration
To ensure these diagrams remain useful, they must fit into the development workflow. They should not exist in a vacuum.
Keep it Lightweight 📝
Avoid excessive detail. Focus on the nodes and connections that matter. Use standard icons to reduce cognitive load. If a diagram takes more than an hour to update, it is likely too complex for the current need.
Version Control Everything 📂
Store diagrams alongside the code. Treat them as part of the product backlog. This ensures that changes to the architecture are tracked and reviewed during pull requests.
Integrate with CI/CD 🔄
Automate the generation of diagrams where possible. Use Infrastructure as Code to derive the visual representation. This ensures the diagram is always in sync with the actual environment.
Define Ownership 👤
Assign a specific role to maintain the diagram. If everyone is responsible, often no one is. The DevOps engineer or the System Architect should own the artifact.
Link to User Stories 🎯
When a story involves infrastructure changes, link the diagram update to the ticket. This ensures the documentation is part of the Definition of Done.
⚠️ Common Pitfalls to Avoid
Even with good intentions, teams often misuse deployment diagrams. Recognizing these pitfalls helps maintain efficiency.
- Outdated Information: A diagram that does not reflect the current state is worse than no diagram. It misleads the team.
- Over-Engineering: Creating diagrams for every microservice leads to maintenance hell. Focus on the high-level view.
- Static Documentation: Storing diagrams in a static wiki without a process for updates makes them obsolete quickly.
- Lack of Context: Diagrams without legends or explanations confuse readers. Always provide a key for symbols used.
- Ignoring Dependencies: Failing to show network dependencies can lead to security vulnerabilities or connectivity issues.
🔍 Diagrams vs. Infrastructure as Code
Modern development often relies on Infrastructure as Code (IaC). IaC scripts define the environment programmatically. Does this make deployment diagrams obsolete?
Not entirely. While IaC is the source of truth for configuration, diagrams provide a human-readable summary. Developers who are not familiar with the scripting language can understand the architecture through a visual representation.
- IaC: Best for execution and version control of configuration.
- Diagram: Best for communication and high-level understanding.
Use both. Let the code manage the infrastructure, and use the diagram to explain it to the team.
🌐 Cloud and Hybrid Environments
Most modern systems are not purely on-premise. They utilize cloud providers and hybrid setups. This adds complexity to deployment diagrams.
- Cloud Boundaries: Clearly mark what is inside the cloud and what is external.
- Network Security: Show firewalls, subnets, and security groups.
- Data Flow: Indicate how data moves between services and storage.
Accuracy is crucial here. Misrepresenting a cloud boundary can lead to security breaches or compliance failures.
🤝 Collaboration and Communication
Deployment diagrams are primarily communication tools. They bridge the gap between developers, operations, and business stakeholders.
- For Developers: Understand where their code runs.
- For Operations: Understand how to monitor and maintain the system.
- For Stakeholders: Understand the cost and complexity of the infrastructure.
When a diagram facilitates a conversation, it has succeeded. If it sits in a folder and is never opened, it has failed.
📉 When to Skip the Diagram
There are times when a deployment diagram is unnecessary. Avoid creating them in the following situations.
- Small Monoliths: If the system runs on a single server, a diagram adds no value.
- Simple Scripts: Automation scripts do not require architectural mapping.
- Proof of Concept: During early experimentation, focus on functionality, not structure.
- Short-Lived Features: Temporary features that will be removed quickly do not need permanent documentation.
📝 Maintenance and Lifecycle
Diagrams have a lifecycle. They are created, updated, and eventually archived. Managing this lifecycle is part of the technical debt strategy.
Regularly review the diagrams during retrospectives. Ask the team if the current documentation is helpful. If the answer is no, adjust the process. Documentation should serve the team, not the other way around.
🎯 Conclusion
Deployment diagrams are not mandatory artifacts in every Agile cycle. However, they are powerful tools when used correctly. They provide clarity in complex environments and facilitate communication across teams.
The key is balance. Do not let documentation slow down delivery. Do not let the lack of documentation create confusion. Use diagrams when the infrastructure complexity demands it, and keep them updated to ensure they remain accurate.
By focusing on the right moments to create and maintain these visualizations, teams can maintain a healthy balance between speed and stability. This approach ensures that the architecture supports the product without becoming a burden.

