Technical diagrams serve as the blueprint for software infrastructure. They are the communication bridge between architects, developers, and operations teams. However, a deployment diagram that lacks precision can lead to significant friction during implementation. Many organizations invest time in creating visual representations of their systems, yet these diagrams often fail to capture the full scope of the environment.
This guide addresses the common gaps found in deployment diagrams. It provides a structured approach to identifying missing elements and implementing fixes. By focusing on accuracy and completeness, teams can reduce deployment errors and improve system reliability.
Why Deployment Diagrams Often Fall Short 📉
A deployment diagram maps the physical hardware or cloud resources where software artifacts are executed. It shows nodes, communication paths, and the distribution of components. Despite their importance, these diagrams frequently suffer from oversimplification.
Several factors contribute to this issue:
- Abstraction Overload: Architects often prioritize high-level logic over physical details, omitting critical infrastructure specs.
- Dynamic Environments: Cloud infrastructure changes rapidly. A static diagram becomes outdated quickly if not maintained.
- Communication Gaps: Developers may not understand the specific requirements of the operations team, leading to missing configuration details.
- Legacy Assumptions: Teams rely on mental models of the system rather than documented evidence.
When these gaps exist, the result is ambiguity. Operations engineers may guess at server specifications or network protocols, leading to performance bottlenecks or security vulnerabilities.
Essential Elements Often Missing 🔍
To create a robust deployment diagram, you must include specific data points. Without them, the diagram is merely a sketch, not a technical specification. Below are the core components frequently overlooked.
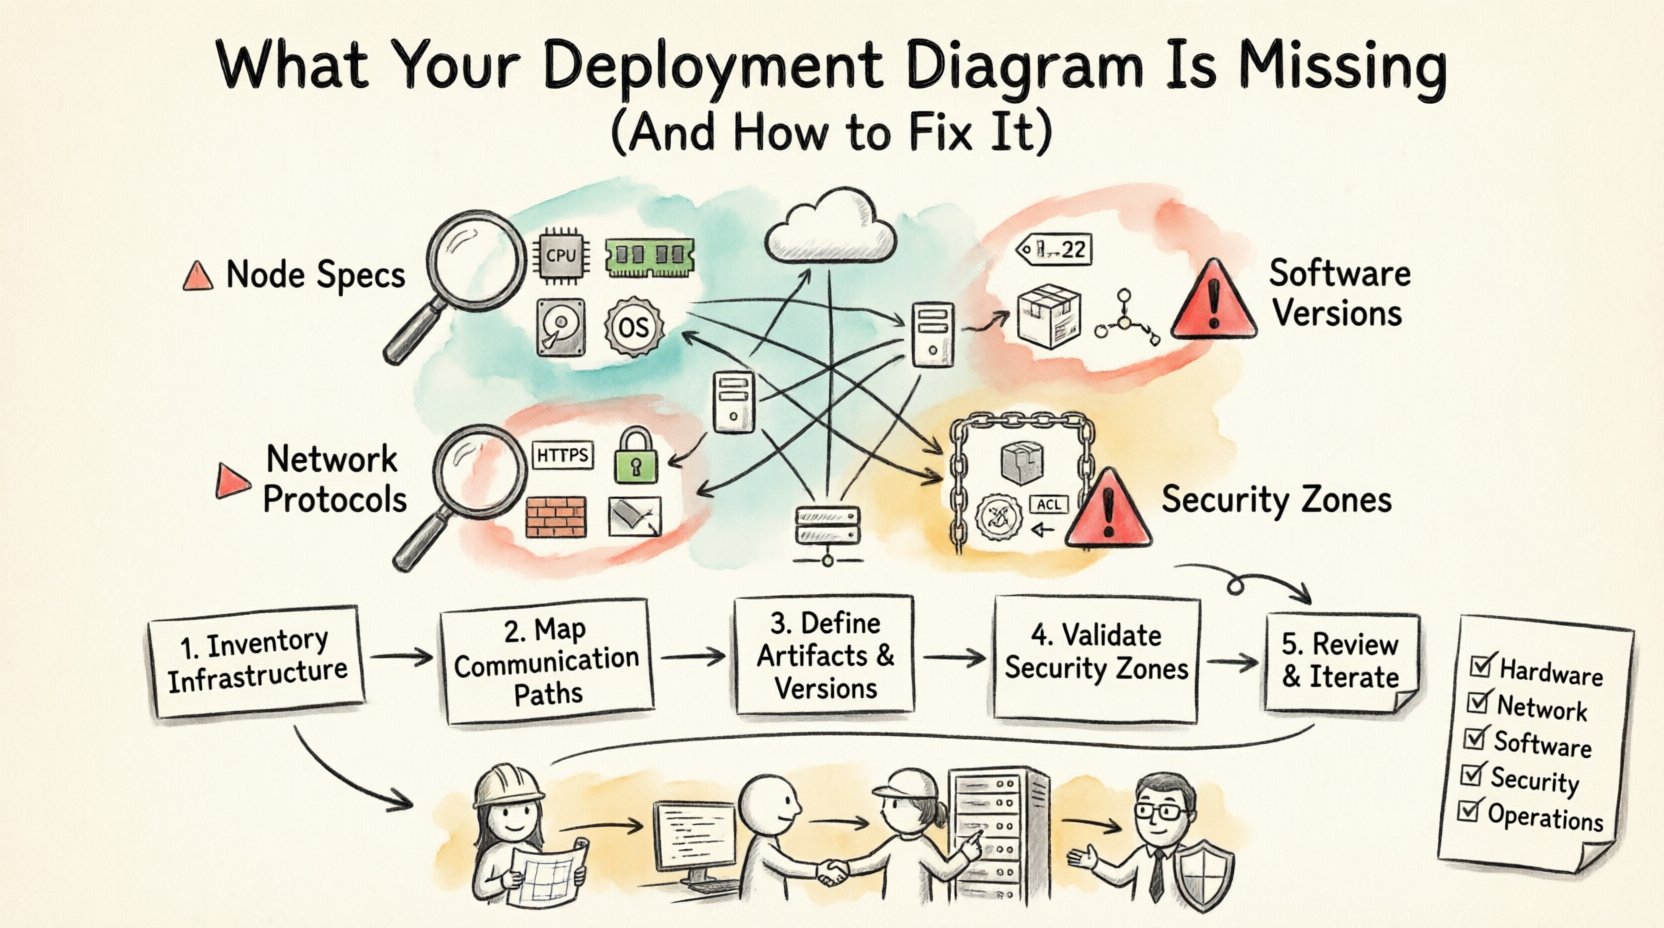
1. Node Specifications and Resources ⚙️
Every node represents a processing unit, such as a server, container, or device. A common error is labeling a node as “Web Server” without specifying its capabilities.
Missing details include:
- CPU Architecture: Is the node x86, ARM, or specialized hardware?
- Memory Allocation: How much RAM is available for the application processes?
- Storage Type: Are we dealing with SSD, HDD, or network-attached storage?
- Operating System: The specific version and distribution of the OS.
Without this information, capacity planning becomes impossible. A team might deploy a heavy data processing tool onto a node that lacks the necessary memory, causing immediate crashes.
2. Communication Protocols and Ports 🌐
Lines connecting nodes indicate data flow. Often, these lines are drawn without context. A simple line does not explain how the data moves.
Ensure the following are documented:
- Protocol Type: Is the traffic HTTP, HTTPS, gRPC, or TCP?
- Port Numbers: Specific ports (e.g., 443, 8080) must be defined to avoid firewall conflicts.
- Encryption Status: Is the communication encrypted in transit?
- Load Balancing: Are there load balancers between nodes, and what algorithm do they use?
Network security teams need this data to configure firewalls correctly. If a port is not specified, the connection may be blocked, or worse, opened to unsecured traffic.
3. Software Artifacts and Versions 📦
Deployment diagrams show where software runs. However, simply showing an icon for “Application” is insufficient. The diagram must link to the specific build or version.
Key missing artifacts include:
- Version Numbers: Specific releases of the software.
- Dependencies: External libraries or middleware required by the application.
- Configuration Files: Where environment variables or config files are stored.
- Database Schema: If a database node is present, what schema version is active?
Versioning is critical for rollback procedures. If a diagram does not indicate the version, troubleshooting why a specific feature is broken becomes a guessing game.
4. Security Boundaries and Permissions 🔒
Security is often an afterthought in diagramming. A deployment diagram should reflect security zones and access controls.
Include these security markers:
- Zoning: Which nodes are in the public internet zone vs. the private intranet?
- Authentication Methods: How do services authenticate each other (e.g., mTLS, API Keys)?
- Firewalls: Where are the security groups or perimeter firewalls located?
- Access Control Lists: Which nodes are permitted to talk to which others?
Ignoring security boundaries in the diagram can lead to compliance failures. Auditors often request diagrams to verify network segmentation. A vague diagram will not suffice.
Impact of Incomplete Diagrams on Operations 🚨
When diagrams lack detail, the operational cost increases. Here is how missing information directly affects the workflow.
Increased Debugging Time
When a service fails, engineers look to the diagram to understand the topology. If the diagram shows a connection but not the protocol, the team must scan logs and network traces to identify the issue. This adds hours to the resolution time.
Scaling Difficulties
Scaling requires knowing the current capacity. If the diagram does not list resource limits, adding new nodes becomes a trial-and-error process. Teams may over-provision resources to be safe, increasing costs, or under-provision, risking downtime.
Onboarding Friction
New hires rely on documentation to understand the system. A deployment diagram is a primary reference. If it is incomplete, new engineers spend weeks mapping the system manually instead of focusing on development.
Step-by-Step Guide to Fixing Your Diagram 🛠️
Improving a deployment diagram requires a systematic audit. Follow these steps to bring your diagram up to date.
Step 1: Inventory Current Infrastructure
Begin by gathering data from the actual environment. Do not rely on memory or old documentation.
- Run discovery scripts to list active nodes.
- Check cloud provider consoles for resource configurations.
- Interview system administrators for hardware specifications.
Step 2: Map Communication Paths
Trace the data flow between nodes. Use network monitoring tools to verify traffic patterns.
- Identify all active ports.
- Verify encryption methods used on each link.
- Document any third-party services or APIs involved.
Step 3: Define Artifacts and Versions
Link the visual nodes to the actual software builds.
- Update version tags on all nodes.
- List required environment variables.
- Document database migration states.
Step 4: Validate Security Zones
Review the network segmentation against security policies.
- Mark public-facing nodes clearly.
- Indicate internal-only nodes.
- Annotate firewall rules between zones.
Step 5: Review and Iterate
A diagram is never truly finished. Schedule regular reviews to ensure it matches the live environment.
- Update the diagram after every major release.
- Assign ownership to a specific architect or engineer.
- Integrate diagram updates into the deployment pipeline.
Checklist for Deployment Diagram Completeness 📋
Use this table to verify your diagram covers all necessary aspects before sharing it with stakeholders.
| Category | Element | Status |
|---|---|---|
| Hardware | CPU Type and Count | ☐ |
| Hardware | RAM and Storage Type | ☐ |
| Network | Protocol and Port Numbers | ☐ |
| Network | Encryption and Firewall Rules | ☐ |
| Software | Application Version | ☐ |
| Software | Middleware and Dependencies | ☐ |
| Security | Authentication Mechanism | ☐ |
| Security | Access Control Lists | ☐ |
| Operations | Backup and Recovery Points | ☐ |
| Operations | Monitoring and Logging Agents | ☐ |
Best Practices for Maintenance and Accuracy ✅
Once the diagram is correct, the goal is to keep it that way. Maintenance is often neglected, leading to the same problems recurring.
Automate Where Possible
Manual updates are prone to human error. Where tools exist, use them to generate diagram data from the infrastructure state. This ensures the diagram reflects reality automatically.
Version Control Documentation
Store the diagram files in a version control system. This allows you to track changes over time. If a deployment fails, you can compare the diagram from that date to the current state.
Integrate with CI/CD Pipelines
Include diagram validation in the deployment process. If the infrastructure changes, the diagram update should be a requirement for the merge request. This forces the team to document changes as they happen.
Standardize Notation
Use a consistent set of symbols. If one team uses a hexagon for a database and another uses a cylinder, confusion arises. Establish a standard legend and enforce it across the organization.
Regular Audits
Schedule quarterly reviews. Walk through the diagram with the operations team. Ask them if the diagram helps them solve problems. If it does not, identify why and adjust the content.
Addressing Complex Scenarios 🏗️
Some environments are too complex for a single diagram. Microservices, distributed systems, and hybrid clouds require specific handling.
Microservices Architecture
In microservices, hundreds of nodes may exist. A single diagram will become unreadable. Instead, group services by function.
- Create a high-level view showing major clusters.
- Create detailed views for specific service domains.
- Use hyperlinks or separate files to navigate between views.
Hybrid and Multi-Cloud
When using multiple cloud providers, the diagram must show the boundaries clearly.
- Label the cloud provider for each node.
- Show the interconnection methods (e.g., Direct Connect, VPN).
- Highlight data residency requirements.
Serverless Environments
Serverless functions often lack persistent nodes. The diagram should represent the event triggers and the execution environment.
- Map the event sources (queues, APIs).
- Define the memory and timeout configurations.
- Illustrate the stateless nature of the functions.
The Role of Collaboration in Diagram Accuracy 🤝
Creating a deployment diagram is a collaborative effort. It requires input from multiple disciplines.
Architects
Define the logical structure and high-level constraints.
Developers
Provide details on application requirements, dependencies, and API contracts.
Operations
Supply information on hardware, network topology, and security policies.
Security Teams
Validate access controls, encryption standards, and compliance requirements.
When these groups work in silos, the diagram becomes fragmented. Regular cross-functional meetings ensure the diagram remains a single source of truth.
Conclusion on Diagram Integrity 🔗
A deployment diagram is a living document. It must evolve as the system evolves. Ignoring missing elements creates technical debt that manifests as operational failures. By systematically auditing your diagrams and enforcing standards, you ensure that the visual representation matches the physical reality.
Focus on the missing details: resource specs, protocols, versions, and security. Implement a process for maintenance. This investment pays off in reduced downtime, faster onboarding, and clearer communication. Treat the diagram as a critical component of your infrastructure, not just a drawing.
Start your audit today. Identify the gaps. Fill them. Your future deployments will thank you.

")