Creating a unified view of hybrid infrastructure requires precise architectural documentation. When systems span across public cloud environments and private data centers, a single deployment diagram becomes essential for stakeholders to understand data flow, dependencies, and physical boundaries. This guide outlines the methodology for constructing accurate diagrams that represent both environments without confusion. By adhering to standard modeling conventions, you ensure clarity for developers, operations teams, and security auditors. 🛡️
Understanding the Hybrid Context 🌐
A deployment diagram visualizes the physical or virtual hardware and software architecture of a system. In a hybrid model, this means depicting resources that are logically distinct but functionally integrated. The challenge lies in maintaining visual consistency while distinguishing between the managed nature of cloud services and the administrative control of on-premise hardware. Without clear differentiation, the diagram fails to communicate risk, latency, or ownership.
When modeling these environments, keep the following objectives in mind:
- Clarity: Viewers must instantly recognize which components reside in which environment.
- Accuracy: The topology must reflect actual network paths and connectivity protocols.
- Maintainability: The diagram should remain valid as infrastructure changes over time.
- Security: Boundaries such as firewalls and encryption zones must be explicitly shown.
Core Components of the Diagram 📊
To build a robust representation, you must define the standard elements used in UML-based deployment modeling. These elements form the vocabulary of your diagram.
1. Nodes and Devices
Nodes represent the physical or virtual execution environments. In a hybrid setup, nodes are categorized by their location and management type.
- Cloud Node: Represents a virtual machine, container, or serverless function hosted by a third-party provider. These are typically ephemeral or scaled dynamically.
- On-Premise Node: Represents physical servers, mainframes, or local virtualization hosts managed by internal IT teams. These often have fixed capacity and hardware dependencies.
- Network Node: Routers, switches, and load balancers that facilitate traffic between the two environments.
2. Artifacts
Artifacts represent the physical software components deployed on the nodes. Examples include executables, libraries, configuration files, or database schemas. Ensure that artifacts are linked to the specific node where they reside.
- Executable Files: Binaries running on the operating system.
- Database Files: Data stores residing on storage volumes.
- Configuration: Scripts or files that define runtime behavior.
Visual Conventions for Differentiation 👁️
Consistency is key to readability. Since you cannot rely on color alone for accessibility, use shapes, stereotypes, and borders to distinguish environments.
Using Stereotypes
Apply specific stereotypes to node shapes to indicate their origin. This is the most formal way to denote environment types within the modeling standard.
- Cloud Stereotype: Use a label like
«Cloud»or«Public»on the box representing the cloud node. - On-Premise Stereotype: Use a label like
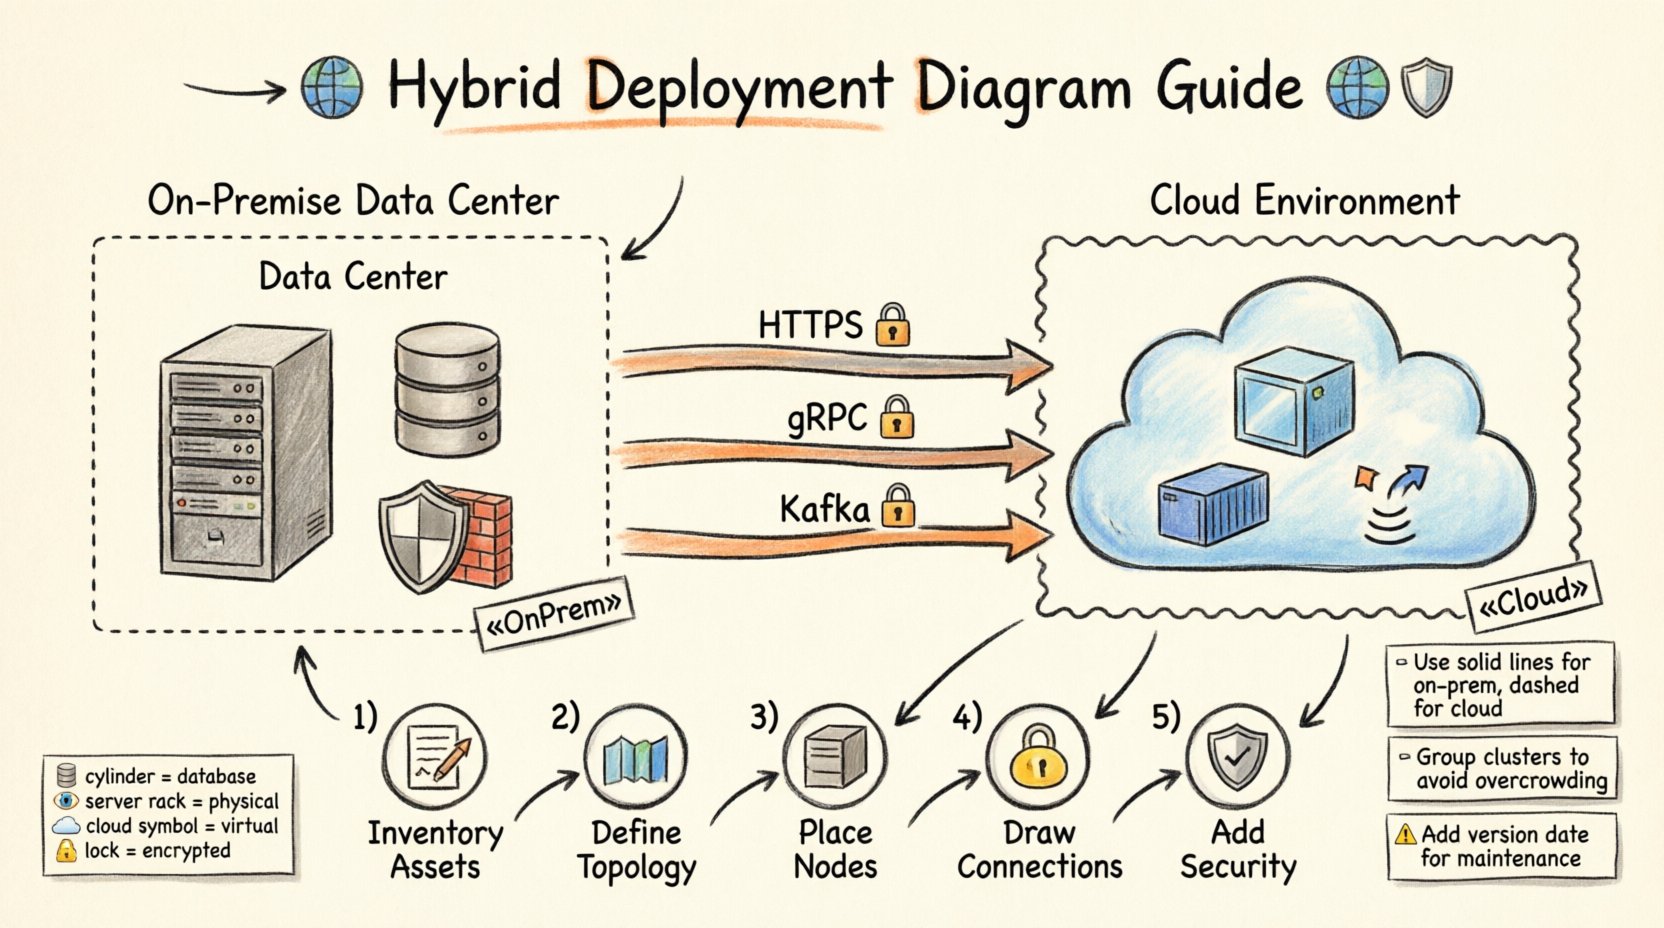
«Server»or«OnPrem»on the box representing local infrastructure. - Boundary Boxes: Group cloud nodes inside a larger boundary labeled “Cloud Environment” and on-premise nodes inside “Data Center”.
Color and Shape Guidelines
While avoiding specific tools, follow general design principles for visual hierarchy.
- Shape: Use a cylinder for databases regardless of location, but place the boundary box around the cylinder to show the environment.
- Border Style: Use solid lines for on-premise connections and dashed lines for cloud connections to imply a logical network separation.
- Icons: Incorporate icons such as a server rack for local hardware and a cloud symbol for remote services.
Modeling Connectivity and Protocols 📡
The lines connecting nodes represent communication paths. In a hybrid model, these paths cross security boundaries and network segments. You must document the protocol and security context of these links.
Network Protocols
Label your association lines with the communication protocol used. This helps developers understand latency requirements and compatibility.
- HTTP/HTTPS: Standard web traffic. Indicate if SSL/TLS is enforced.
- gRPC/REST: Internal microservice communication.
- Database Protocols: SQL, NoSQL, or specific connection strings.
- Message Queues: AMQP, Kafka, or proprietary messaging systems.
Bandwidth and Latency
Not all connections are equal. A link from a local server to a local switch differs from a link to a public cloud region. Consider annotating the diagram with qualitative notes on performance.
- High Latency: Mark connections crossing the internet with a note indicating potential delays.
- High Bandwidth: Mark dedicated lines (like Direct Connect or ExpressRoute equivalents) with higher throughput indicators.
- Redundancy: Show multiple paths for critical services to indicate failover capabilities.
Security Boundaries and Zones 🔒
Security is paramount when modeling hybrid systems. A deployment diagram should not hide the perimeter. Explicitly draw the boundaries that protect sensitive data.
Firewalls and Gateways
Place firewall nodes at the edge of the network segments. Show where traffic is inspected before entering the internal cloud or on-premise zone.
- Perimeter Firewall: Protects the on-premise data center from external threats.
- Cloud Gateway: Protects the cloud environment from public internet traffic.
- DMZ: A demilitarized zone where public-facing services reside, separated from internal databases.
Encryption and Compliance
Indicate where data is encrypted. This is crucial for compliance audits.
- In-Transit: Mark lines with a lock icon to show encryption during transmission.
- At-Rest: Mark storage nodes with a lock icon to show encryption on the disk.
- Compliance Zones: Use dashed lines to group nodes that must adhere to specific regulations (e.g., GDPR, HIPAA).
Step-by-Step Modeling Process 📝
Follow this structured approach to create your diagram without missing critical details.
Step 1: Inventory Assets
Before drawing, list all components. Create a spreadsheet or text list of every server, database, and service involved. Separate them by environment.
- List all on-premise servers and their roles.
- List all cloud instances and their service types (e.g., compute, storage).
- Identify all third-party integrations.
Step 2: Define Topology
Sketch the high-level network layout. Decide where the boundaries lie. Place the on-premise box on the left and the cloud box on the right, or use a vertical split depending on the complexity.
- Draw the primary network boundary.
- Draw the secondary network boundary for the cloud.
- Mark the connection point between them (e.g., VPN, Peering).
Step 3: Place Nodes and Artifacts
Drag and drop your inventory items into the appropriate boundaries. Ensure artifacts are contained within the nodes they deploy to.
- Place application binaries on the compute nodes.
- Place data files on the storage nodes.
- Place configuration files on the management nodes.
Step 4: Draw Connections
Draw lines between nodes based on the data flow. Add labels for protocols.
- Draw lines for API calls.
- Draw lines for database replication.
- Draw lines for authentication flows.
Step 5: Add Security Annotations
Review the diagram for security gaps. Add labels for encryption and firewalls.
- Mark all internet-facing ports.
- Mark all internal-only ports.
- Verify that sensitive data paths are secured.
Common Pitfalls to Avoid ⚠️
Even experienced architects make mistakes when modeling hybrid systems. Be aware of these common errors.
1. Overcrowding the Diagram
Do not try to show every single server. Group similar servers into clusters or logical nodes. A diagram with 50 individual boxes is unreadable.
- Grouping: Use a single node labeled “Web Server Cluster” instead of five individual nodes.
- Abstraction: Hide internal details of a service unless they are relevant to the deployment context.
2. Ignoring Data Synchronization
In hybrid models, data often needs to move between environments. If you do not show replication, the diagram is incomplete.
- Show bidirectional arrows for data sync.
- Label the frequency of synchronization (e.g., “Real-time”, “Hourly Batch”).
3. Mixing Logical and Physical Views
A deployment diagram should be physical or virtual. Do not mix logical component diagrams with deployment nodes. Keep the focus on hardware and software installation.
- Do not show class diagrams inside deployment nodes.
- Do not show user roles unless they are represented by distinct hardware terminals.
4. Outdated Information
Cloud infrastructure changes rapidly. A diagram from six months ago may be obsolete.
- Versioning: Add a version number or date to the diagram title.
- Review Cycle: Schedule regular reviews of the architecture documentation.
Comparison of Modeling Approaches 📋
Different teams may prefer different levels of detail. The table below summarizes common approaches.
| Approach | Detail Level | Best For | Limitation |
|---|---|---|---|
| High-Level Overview | Low | Executive Summaries | Lacks technical specifics |
| Standard Deployment | Medium | Development Teams | May miss security nuances |
| Detailed Infrastructure | High | Operations & Security | Hard to maintain long-term |
| Logical Hybrid | Mixed | Architecture Planning | Does not reflect physical limits |
Maintaining the Diagram 🔄
A deployment diagram is a living document. It requires maintenance to remain useful. Treat it as code.
Automated Updates
Where possible, generate diagrams from infrastructure code. This ensures the visual representation matches the actual state.
- Infrastructure as Code: Use scripts to parse resource definitions.
- Monitoring Data: Integrate with monitoring tools to show active nodes.
Documentation Standards
Establish a standard for naming and labeling. Consistency reduces cognitive load for anyone reading the diagram.
- Naming Convention: Use
env-role-id(e.g.,prod-web-01). - Legend: Always include a legend explaining symbols and colors.
- Metadata: Include the date of the last update and the author.
Conclusion on Hybrid Modeling 🏁
Modeling cloud and on-premise systems in a single deployment diagram is a necessary skill for modern architecture. It bridges the gap between physical hardware and virtual services. By following standard conventions, using clear stereotypes, and maintaining rigorous security boundaries, you create a document that serves both technical and business needs. This approach ensures that everyone from the CTO to the junior developer understands the system landscape. Remember to keep the diagram updated and focused on the physical reality of your infrastructure. 🚀

