Understanding the physical structure of a software system is often just as critical as understanding the code itself. When development teams, operations engineers, and stakeholders discuss how an application runs, they need a shared visual language. This is where the deployment diagram becomes essential. It maps the hardware and software artifacts onto the infrastructure, providing a blueprint for how the system exists in the real world.
This guide explores the mechanics of deployment diagrams, why they are indispensable for system architecture, and provides detailed real-world examples. We will move beyond abstract definitions to examine how these diagrams function in actual enterprise environments, ensuring that your infrastructure planning is grounded in clarity and precision.
🔍 What is a Deployment Diagram?
A deployment diagram is a type of Unified Modeling Language (UML) diagram that shows the physical deployment of artifacts on nodes. It provides a static view of the runtime environment. Unlike a class diagram, which focuses on the internal structure of software classes, or a sequence diagram, which focuses on the flow of messages, a deployment diagram focuses on the topology.
Think of it as a map for your IT infrastructure. It answers specific questions that other diagrams do not:
- Where does the application code actually run?
- What hardware resources are required for the database?
- How do different servers communicate with one another?
- Is the system distributed across multiple locations?
By visualizing the connection between the software artifacts and the processing nodes, teams can identify bottlenecks, plan for scalability, and troubleshoot connectivity issues more effectively. It bridges the gap between logical design and physical implementation.
🧱 Core Components of a Deployment Diagram
To create a meaningful diagram, one must understand the specific symbols and concepts used to represent infrastructure. Every deployment diagram is constructed from a set of standard elements. Understanding these building blocks ensures that the diagram remains readable and standardized across different teams.
1. Nodes (Processing Resources)
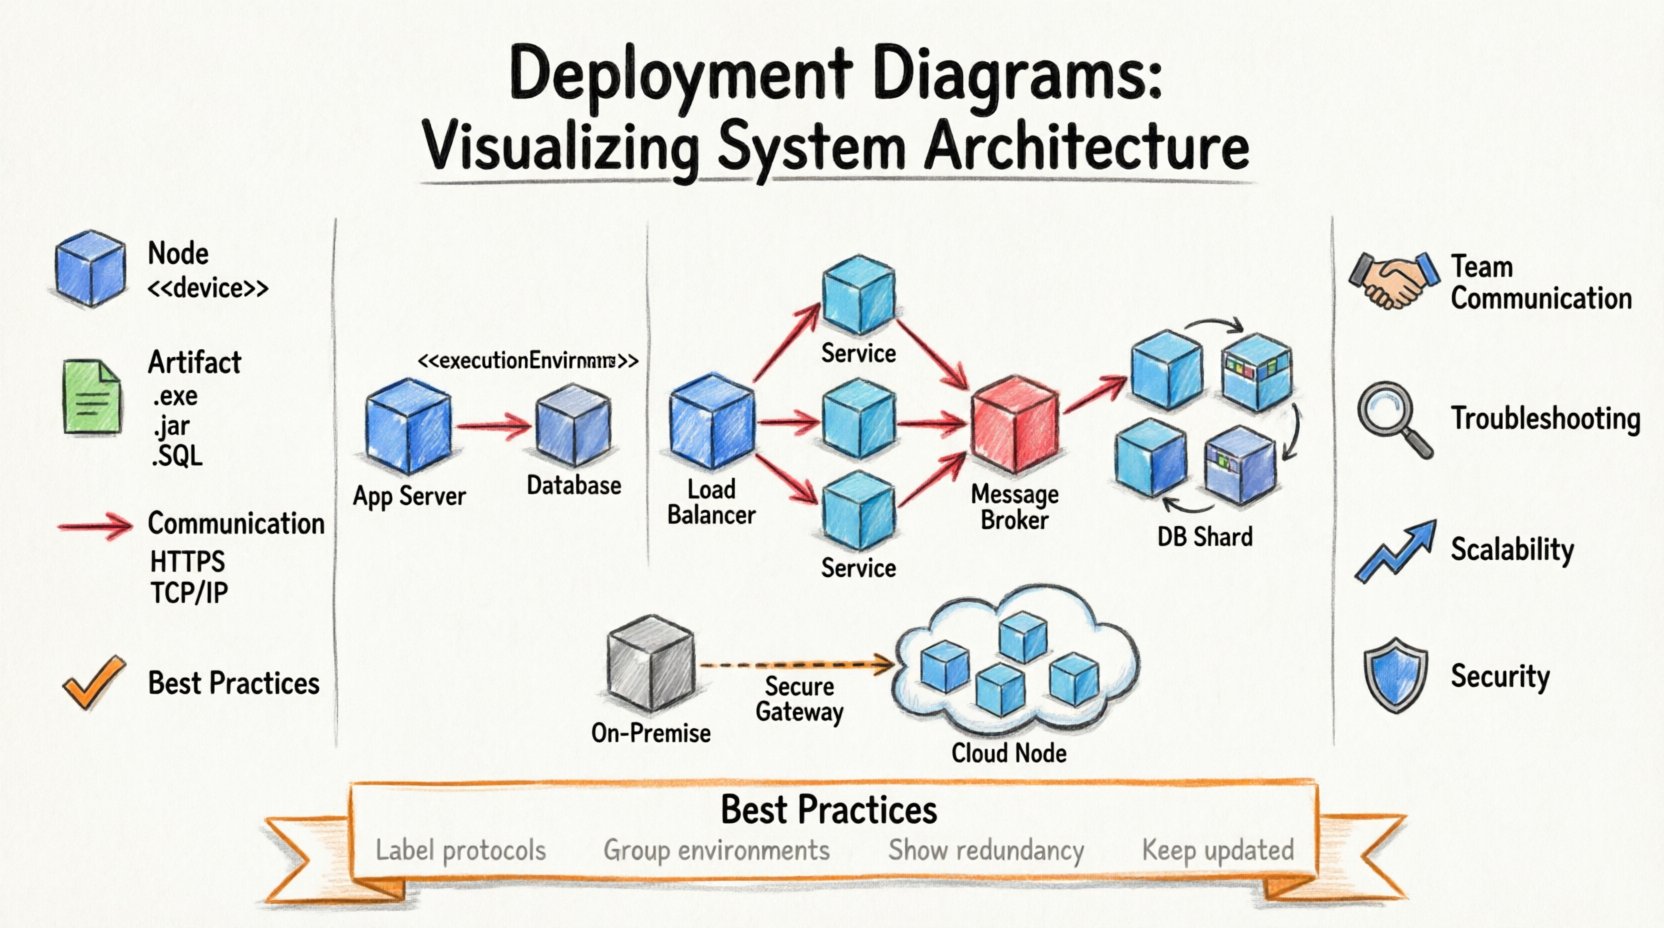
A node represents a computational resource. It is the physical or virtual machine where artifacts are deployed. Nodes are depicted as 3D cubes or boxes. There are two main types of nodes:
- Device Nodes: Represent physical hardware such as servers, routers, smartphones, or IoT devices. These are often labeled with their specific hardware specifications if relevant.
- Execution Environments: Represent a software environment that manages the execution of software components. Examples include operating systems, containers, or virtual machines.
2. Artifacts
Artifacts are the physical pieces of software that are deployed onto the nodes. They are shown as rectangles with a specific icon indicating their file type. Examples include:
- Executable files (.exe, .jar)
- Database schemas
- Configuration files
- Web pages and static assets
- Libraries and dependencies
Placing artifacts on nodes clarifies ownership. It shows exactly which piece of code is responsible for which function on the server.
3. Communication Paths
These are the lines connecting the nodes. They represent the flow of information between the processing resources. They can be labeled to indicate the protocol used, such as HTTP, TCP/IP, or SSH. This is crucial for security planning and understanding latency.
4. Associations and Dependencies
Nodes can be associated with one another to indicate logical grouping or physical proximity. Dependencies indicate that one node requires another to function correctly. For example, a web server depends on a database server to retrieve user data.
📊 Component Breakdown Table
The following table summarizes the key elements you will encounter when constructing a deployment diagram. Refer to this when designing your architecture maps.
| Element | Symbol | Function | Example |
|---|---|---|---|
| Node | Cube / Box | Represents hardware or environment | Linux Server, Cloud VM |
| Artifact | Document Icon | Represents deployable software unit | App.exe, SQL Schema |
| Communication Path | Line with Arrow | Represents network connection | HTTPS, API Gateway |
| Dependency | Dashed Line | Indicates reliance between nodes | Service A needs Service B |
🚀 Why Architecture Visualization Matters
Many teams skip the step of documenting their deployment architecture, relying instead on tribal knowledge or scattered configuration files. This approach often leads to errors during deployment or scaling. A well-documented diagram provides several tangible benefits.
1. Improved Communication Between Teams
Developers write code, but operations teams manage the servers. Without a shared visual reference, misunderstandings occur. A developer might assume a service runs locally, while the operations team has it configured for a containerized environment. The diagram serves as the single source of truth that aligns both groups.
2. Easier Troubleshooting
When a system goes down, engineers need to know where to look. If you know the database is on Node A and the application is on Node B, and Node A is unresponsive, the scope of the problem narrows immediately. The diagram acts as a map for incident response.
3. Scalability Planning
As user traffic grows, the architecture must evolve. A deployment diagram allows architects to simulate changes. If you plan to add a load balancer, you can visualize where it fits in the current topology before implementing it. This prevents costly rework after the fact.
4. Security Auditing
Security teams need to understand the data flow. By mapping communication paths, they can identify unencrypted connections or unnecessary exposure of internal nodes to the public internet. It highlights where firewalls and gateways are needed.
🌍 Real-World Scenarios and Case Studies
Abstract concepts become clear when applied to actual systems. Below are three detailed scenarios illustrating how deployment diagrams function in different architectural styles. These examples demonstrate the mapping of software to hardware without referencing specific commercial tools.
Scenario 1: The Traditional Monolith
In a legacy enterprise application, the system might run as a single unit. The deployment diagram for this setup is relatively simple but requires precision.
- Client Layer: Desktop browsers and mobile apps connect via the internet.
- Web Server Node: A cluster of servers handles incoming HTTP requests. This node hosts the static content and the entry point for the application.
- Application Server Node: This node runs the core business logic. It is connected to the web server via an internal network.
- Database Server Node: A dedicated server holds the persistent data. It is isolated from the public internet for security.
Key Insight: In this scenario, the diagram highlights the single point of failure. If the Application Server Node goes down, the entire system stops. The visual map helps architects decide whether to add redundancy to this specific node.
Scenario 2: Microservices Architecture
Modern systems often break applications into smaller, independent services. This complexity requires a more detailed deployment view.
- Load Balancer Node: Incoming traffic is distributed to various service instances.
- Service Cluster: Multiple nodes host different microservices (e.g., User Service, Payment Service, Inventory Service). These nodes communicate via internal APIs.
- Message Broker Node: A centralized node handles asynchronous communication between services.
- Database Shards: Instead of one database, different services may connect to specific database nodes to reduce coupling.
Key Insight: The diagram reveals the high number of connections. The Load Balancer becomes a critical choke point. The visual map helps the team ensure that the network capacity between the Service Cluster and the Message Broker is sufficient.
Scenario 3: Hybrid Cloud Migration
Organizations often move parts of their infrastructure to the cloud while keeping others on-premise. This creates a hybrid topology.
- On-Premise Node: Legacy data remains on local servers due to compliance requirements.
- Cloud Gateway: A secure connection point bridges the local network and the cloud environment.
- Cloud Compute Nodes: New microservices run in the cloud to handle variable load.
- Cloud Storage Node: Large files and backups are stored in cloud object storage.
Key Insight: Latency is the primary concern here. The diagram shows the path from the Cloud Compute Node back to the On-Premise Node. This visual helps engineers optimize data transfer and decide what data needs to be cached locally to avoid constant long-distance calls.
🛠️ Best Practices for Effective Modeling
Creating a diagram is easy; creating a useful one requires discipline. Follow these guidelines to ensure your deployment diagrams remain valuable assets rather than cluttered wall charts.
- Keep Abstractions Appropriate: Do not show every single rack or switch unless it is relevant to the system’s logic. Focus on the logical nodes. If you have 50 web servers, represent them as a cluster or a single logical node with a note indicating the count.
- Use Stereotypes Consistently: If you use a specific icon style for a database, use it for all databases. This consistency reduces cognitive load for anyone reading the diagram.
- Label Communication Protocols: Never assume the connection type. Label lines with “HTTPS” or “TCP” to make the security and performance implications clear.
- Group Related Nodes: Use containers or boxes to group nodes that belong to the same environment, such as “Production Environment” or “Development Environment”.
- Include Network Boundaries: Clearly mark the firewall lines. Show what is exposed to the public internet versus what is internal. This is vital for security reviews.
⚠️ Common Mistakes to Avoid
Even experienced architects make errors when modeling infrastructure. Being aware of these pitfalls helps you maintain high-quality documentation.
- Ignoring Latency: Drawing a connection between two nodes without considering distance. A diagram that shows a connection between a server in New York and one in London without noting the latency impact is misleading.
- Overloading the Diagram: Trying to show every single dependency in a massive system makes the diagram unreadable. Use abstraction levels. Show high-level flows in one diagram and detailed node connections in another.
- Static Documentation: Creating a diagram and never updating it. If the architecture changes and the diagram does not, it becomes a liability. A false diagram leads to false assumptions.
- Missing Redundancy: Drawing a single path for a critical service. In production, you should almost always show redundant paths to ensure high availability.
🔄 Integrating Deployment Models with Development Workflows
A deployment diagram should not exist in isolation. It must be part of a broader ecosystem of documentation and automation.
1. Integration with CI/CD Pipelines
Modern deployment processes rely on continuous integration and continuous deployment (CI/CD). The artifacts in the diagram (e.g., container images, configuration files) should match the output of the pipeline. When the pipeline builds a new version of the artifact, the deployment diagram should reflect the target environment for that version.
2. Infrastructure as Code (IaC)
Many teams define their infrastructure using code rather than manual configuration. The deployment diagram serves as the visual representation of the code. If you change the code in your IaC repository, the diagram should be regenerated or updated to reflect the new topology. This ensures that the visual map matches the actual code execution.
3. Monitoring and Observability
When setting up monitoring tools, the dashboard should align with the deployment nodes. If a server goes down, the alert should reference the node name shown in the diagram. This correlation speeds up root cause analysis significantly.
📈 Keeping Diagrams Alive
Diagrams decay over time. Systems change, servers are retired, and new services are added. To prevent this decay, treat the diagram as living documentation.
- Version Control: Store your diagram files in the same repository as your code. This ensures that changes to the architecture are reviewed alongside code changes.
- Automated Updates: Where possible, use tools that can generate diagrams from the actual infrastructure configuration. This reduces the manual effort required to keep them accurate.
- Review Cycles: Include diagram updates in the Definition of Done for major features. If a feature changes the server topology, the diagram must be updated before the feature is merged.
- Access Control: Ensure that the diagrams are accessible to all relevant stakeholders. If they are locked away in a private folder, they will not serve their purpose of alignment.
🔗 Relationship with Other Models
The deployment diagram does not work alone. It complements other architectural models to provide a complete picture of the system.
- Component Diagram: Shows the logical structure of the software. The deployment diagram shows where these components physically reside. Together, they connect the “what” (software) with the “where” (hardware).
- Sequence Diagram: Shows the interaction between objects. The deployment diagram provides the context for these interactions, showing which servers are involved in the conversation.
- Activity Diagram: Describes the flow of work. The deployment diagram helps identify which part of the workflow runs on which machine, highlighting potential performance bottlenecks.
By integrating these models, you create a multi-dimensional view of the architecture. This holistic approach is essential for complex systems where software logic and physical constraints are deeply intertwined.
🎯 Final Considerations for Architecture Teams
Investing time in creating accurate deployment diagrams pays dividends throughout the lifecycle of a project. It reduces ambiguity, improves security posture, and speeds up problem resolution. While the initial effort to map the architecture may seem high, the cost of not having a clear map is far greater in the long run.
Start with the high-level topology. As the system matures, add detail to specific areas that are complex or prone to failure. Remember that the goal is clarity, not perfection. A simple diagram that is understood by the team is better than a complex one that is ignored. By following the principles outlined here, you can ensure that your system architecture remains transparent, maintainable, and robust against the challenges of modern software delivery.
Utilize these visual tools to guide your infrastructure decisions. Whether you are planning a migration, scaling a service, or auditing security, the deployment diagram remains one of the most effective instruments for understanding the physical reality of your software systems.
")
")