In the intricate landscape of software architecture, clarity is not merely a preference; it is a necessity. When systems grow in complexity, the underlying logic often becomes obscured by layers of code and implementation details. This is where the component diagram serves as a critical instrument. It strips away the noise of specific syntax and focuses on the structural relationships that define how a system functions. By visualizing the building blocks and their interactions, architects can trace the flow of data and control with precision. This guide explores the mechanics of these diagrams and how they illuminate the hidden logic of modern systems.
📐 Understanding the Component Diagram
A component diagram is a type of static structure diagram used in software engineering to describe the organization and wiring of physical or logical components. Unlike a class diagram, which details the internal logic of individual units, a component diagram operates at a higher level of abstraction. It treats software units as black boxes, focusing on what they provide and what they require rather than how they achieve their function internally.
The primary goal is to reveal the system structure. This means mapping out the boundaries of responsibility. When a developer looks at a component diagram, they should immediately understand the major divisions of the application. This separation allows teams to work on specific areas without needing to understand every line of code in the entire system. It supports modularity and independence, which are essential for scalable development.
Key characteristics of an effective component diagram include:
- Abstraction: It ignores low-level implementation details like variable names or specific algorithms.
- Physical and Logical Views: It can represent logical components (libraries, modules) or physical components (executable files, databases).
- Interfaces: It explicitly defines the points of interaction between different parts of the system.
- Dependencies: It shows how components rely on one another to function.
🔌 The Anatomy of a Component
To understand the logic revealed by these diagrams, one must understand the elements that compose them. A component is not just a box on a page; it represents a modular part of the system that can be replaced or updated without affecting the rest, provided the interfaces remain consistent.
🛠️ Provided and Required Interfaces
The interaction between components is governed by interfaces. These are the contracts that define the communication protocol. There are two types of interfaces to consider:
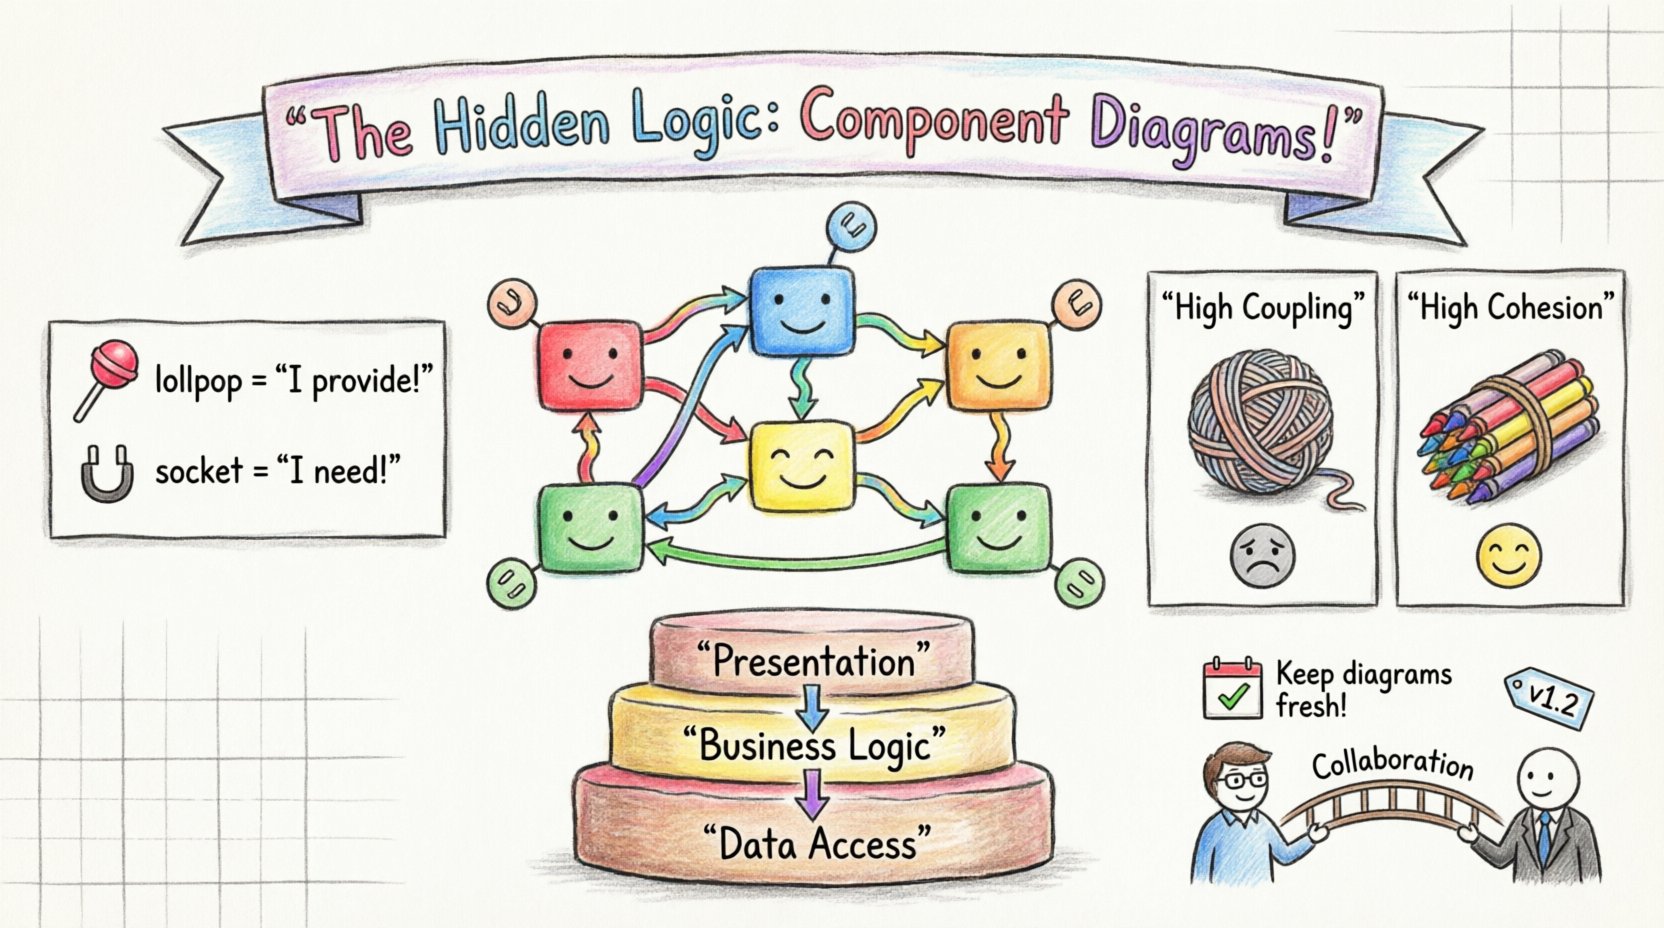
- Provided Interface: This is what a component offers to the outside world. It is often depicted as a “lollipop” symbol in notation. For example, a payment processing component provides an interface for calculating transaction totals.
- Required Interface: This is what a component needs from others to operate. It is often shown as a “socket” symbol. The same payment component might require an interface from a logging component to record transaction history.
Understanding these interfaces is crucial for revealing system structure. If a component requires an interface that no other component provides, the system is broken. If a component provides an interface that no one uses, it is dead weight. The diagram exposes these gaps and redundancies clearly.
⚡ Ports and Connectors
Ports act as the physical or logical entry and exit points for communication. A component might have multiple ports, allowing it to handle different types of traffic simultaneously. Connectors link these ports together, representing the actual flow of data or control signals.
When analyzing a diagram, pay attention to the connectors. They reveal the coupling between components. A direct connection between two components implies a tight relationship. If the connector is complex or numerous, it suggests a high degree of interdependence. This information is vital for maintenance and refactoring efforts.
⚙️ Structural Logic and Dependencies
The true power of a component diagram lies in its ability to visualize dependencies. Dependencies are the relationships where one component relies on another. There are different types of dependencies that dictate the stability and flexibility of the system.
🔗 Types of Dependencies
Not all dependencies are created equal. Some are stable, while others are volatile. Recognizing the type of dependency helps in understanding the risk profile of the system.
- Instantiation: One component creates an instance of another. This is a strong dependency.
- Usage: One component uses the services of another. This is common and generally acceptable.
- Refinement: One component refines the specification of another. This is often used in design documentation.
- Communication: Components exchange messages without direct instantiation. This is typical in distributed systems.
By mapping these dependencies, architects can identify potential bottlenecks. If a single core component is depended upon by every other component in the system, it becomes a single point of failure. The diagram makes this risk visible before the code is even written.
🧱 Coupling and Cohesion
Software design principles often revolve around coupling and cohesion. A component diagram is an excellent tool for assessing these metrics.
Coupling refers to the degree of interdependence between software modules. Low coupling is generally preferred. It means that changes in one component have minimal impact on others. A component diagram reveals high coupling through a dense web of connectors. If you see many lines crossing between modules, it suggests the structure needs refinement.
Cohesion refers to how closely related the responsibilities of a single component are. High cohesion means a component does one thing well. If a component contains functionality for logging, authentication, and database access, its cohesion is low. The diagram helps identify these “god components” that should be split into smaller, more focused units.
🛡️ Best Practices for Clear Modeling
Creating a component diagram is not just about drawing boxes and lines. It requires discipline and adherence to best practices to ensure the diagram remains a useful asset rather than a confusing artifact. Poorly constructed diagrams can obscure logic rather than reveal it.
📏 Defining Granularity
One of the most common challenges is determining the level of detail. If the components are too large, the diagram becomes a high-level overview that lacks actionable insight. If they are too small, it becomes a class diagram in disguise.
The right granularity depends on the context. For a high-level architectural review, components might represent entire subsystems. For a development team, components might represent specific modules or libraries. The key is to choose a level where the internal logic is hidden, but the external behavior is clear.
📝 Naming Conventions
Names carry semantic weight. A component named “Module1” tells a developer nothing about its purpose. A component named “UserAuthenticationService” provides immediate context. Consistent naming conventions ensure that the diagram can be read by anyone involved in the project, regardless of their tenure.
Effective naming should include:
- The function of the component.
- The domain it belongs to.
- The type of component (e.g., Service, Manager, Handler).
🔄 Layering and Separation
Complex systems often follow architectural layers, such as presentation, business logic, and data access. A well-structured component diagram should reflect this separation. Grouping components by layer helps visualize the flow of data from the user interface down to the database and back.
This separation also enforces architectural rules. For instance, the presentation layer should not directly access the data layer. The business logic layer should sit in between. A component diagram can visually enforce this rule by showing that connections only flow between adjacent layers.
🔄 Component vs. Other Diagram Types
While component diagrams are powerful, they are not the only tool in the arsenal. Understanding how they relate to other diagram types prevents confusion and ensures the right tool is used for the right job.
| Diagram Type | Focus | Best Used For |
|---|---|---|
| Component Diagram | High-level structure, interfaces, dependencies | System architecture, deployment planning |
| Class Diagram | Internal structure, attributes, methods | Code implementation, object relationships |
| Deployment Diagram | Hardware nodes, physical artifacts | Infrastructure setup, server topology |
| Sequence Diagram | Time-based interactions, message flow | Behavioral logic, specific use cases |
Using the correct diagram type ensures that the information is presented efficiently. A sequence diagram is better for showing a specific login flow. A component diagram is better for showing the login module’s relationship with the user database module. They complement each other rather than compete.
🛠️ Maintaining Diagram Integrity Over Time
A diagram is only as good as its accuracy. In dynamic development environments, code changes frequently. If the diagram does not change with the code, it becomes misleading. This is known as “diagram rot.” Preventing this requires a strategy for maintenance.
🔄 Synchronization with Code
Automated tools can help keep diagrams in sync with the codebase. Some modeling environments allow for reverse engineering, where the diagram is generated from the source code. While this does not capture high-level intent, it ensures the structure is accurate.
For forward engineering, where the diagram drives the code, strict governance is needed. No component should be added or removed from the codebase without updating the diagram first. This discipline ensures the documentation remains a reliable source of truth.
🗂️ Version Control
Just like code, diagrams should be versioned. Changes to the architecture are significant events. Maintaining a history of diagram versions allows teams to trace the evolution of the system structure. This is particularly useful when troubleshooting issues that were introduced by architectural changes.
📈 The Strategic Value of Visual Logic
Ultimately, the value of a component diagram extends beyond the technical team. It serves as a communication bridge between developers, stakeholders, and management. A well-crafted diagram can explain complex system behaviors without requiring a deep dive into technical specifications.
For stakeholders, the diagram answers the question: “How does this system work?” For developers, it answers: “Where do I fit in?” For maintainers, it answers: “What happens if I change this part?” By revealing the hidden logic of system structure, these diagrams reduce risk and improve decision-making.
Investing time in creating accurate and clear component diagrams pays dividends throughout the lifecycle of the software. It reduces the cognitive load on the team and ensures that the architecture remains robust as the system grows. In a field where complexity is the enemy, structure is the ally. Component diagrams provide that structure, turning abstract logic into a visible, manageable reality.
As you move forward with your own architectural efforts, remember that the goal is not perfection, but clarity. A diagram that is slightly outdated but accurate in its core logic is more valuable than a perfect diagram that is never updated. Focus on the relationships, the interfaces, and the boundaries. These are the elements that reveal the true nature of the system.

