Understanding how software systems are constructed is a fundamental skill for any computer science student. While class diagrams show the internal structure of individual objects, component diagrams provide a higher-level view of how distinct modules interact within a larger system. This guide explores the practical application of component diagrams, focusing on real-world scenarios that undergraduate students encounter during their academic and early professional careers. By examining specific examples, we aim to clarify the abstract concepts of software architecture and modeling.
Component diagrams are a type of Unified Modeling Language (UML) diagram used to represent the physical and logical architecture of a system. They break down complex systems into manageable parts, known as components, and define the relationships between them. This approach is essential for maintaining scalability, manageability, and clarity in software projects.
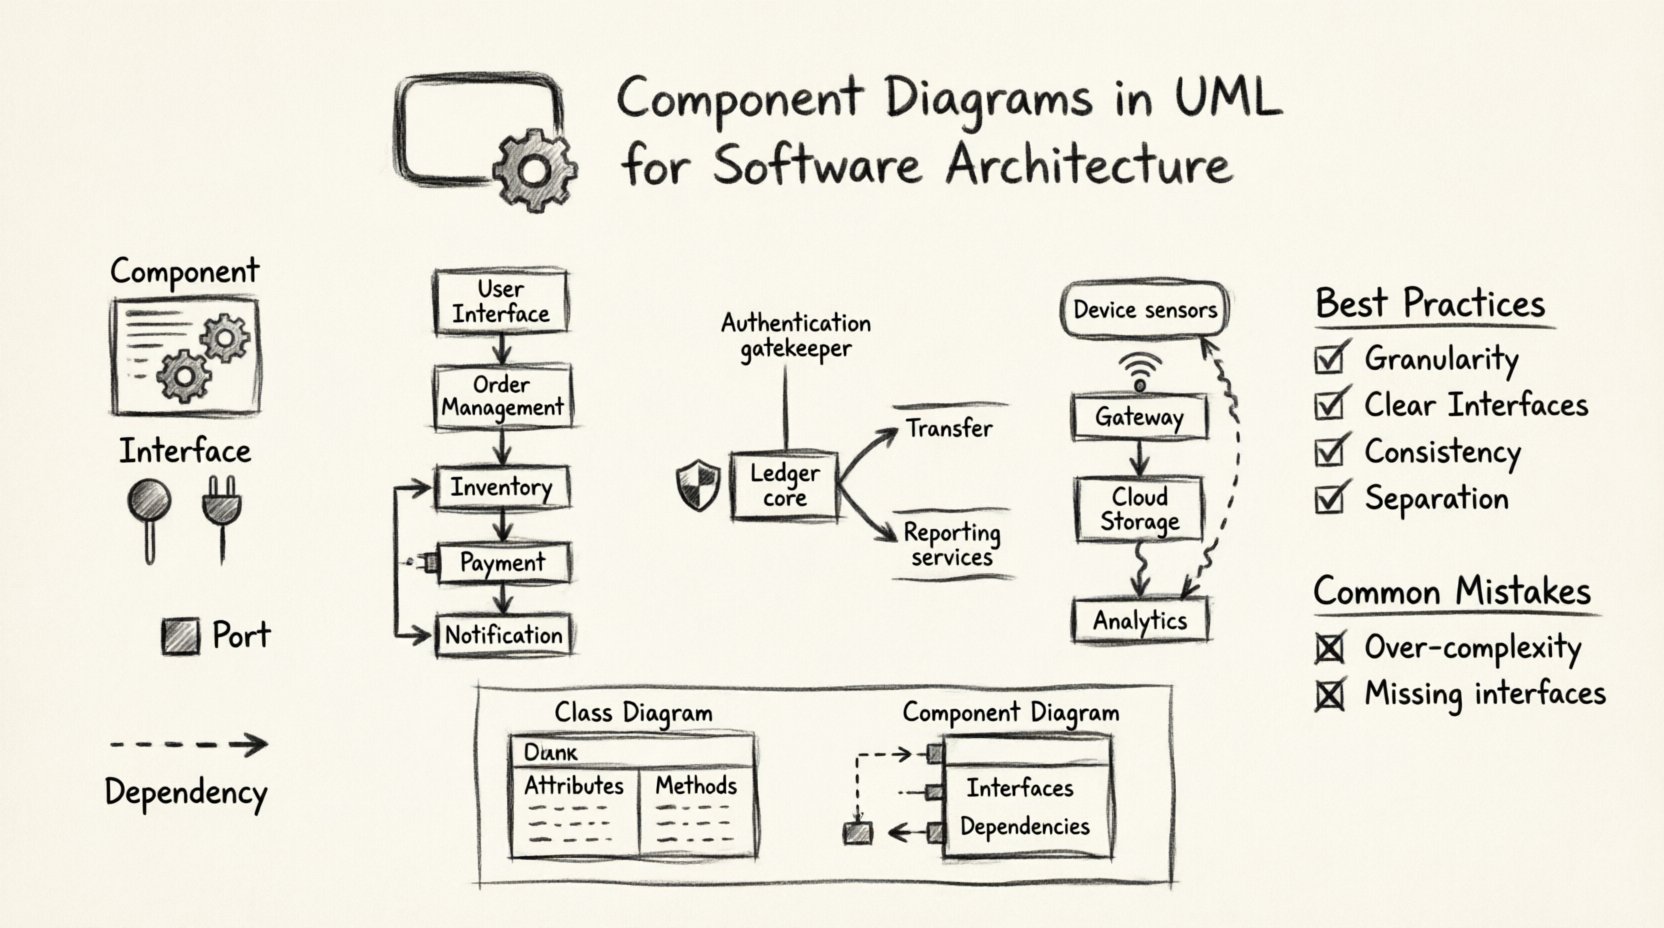
Core Concepts of Component Modeling 🧱
Before diving into examples, it is necessary to establish a solid understanding of the building blocks used in component diagrams. These elements form the vocabulary of system design and ensure that all stakeholders interpret the architecture consistently.
- Component: A modular, replaceable part of a system that encapsulates a set of related functionalities. A component represents a unit of implementation and deployment.
- Interface: A contract that defines a set of operations provided by or required by a component. Interfaces allow components to interact without knowing the internal implementation details.
- Port: A specific point of interaction on a component where an interface is realized. Ports act as the connection points for dependencies.
- Dependency: A relationship indicating that one component relies on another to function correctly. This is often visualized as a dashed line with an open arrow.
Understanding Relationships 🔗
The power of a component diagram lies in how components connect. Misunderstanding these relationships can lead to tightly coupled systems that are difficult to maintain. Below are the primary relationships used in this modeling style.
1. Provided vs. Required Interfaces
Components rarely exist in isolation. They provide services to others and require services from others. Distinguishing between what a component does and what it needs is crucial.
- Provided Interface (Lollipop): Represents a service the component offers. Other components can depend on this interface.
- Required Interface (Plug): Represents a service the component needs to access. This is often a dependency on an external component.
2. Dependency Relationships
Dependency is the most common relationship in component diagrams. It indicates that a change in the supplier component may affect the client component. However, it does not imply ownership or lifecycle management.
3. Association and Realization
While less common than dependency, these relationships add detail to the model. Association indicates a structural link, while realization indicates that a component implements an interface.
Real-World Example 1: E-Commerce Platform 🛒
An e-commerce system is a classic example of a complex software architecture. It involves multiple interactions between users, inventory management, and payment processing. A component diagram for this system helps visualize the separation of concerns.
System Breakdown
In a typical online store, the system can be divided into the following primary components:
- User Interface Component: Handles all interactions with the customer. It includes the shopping cart display, product listing, and checkout forms.
- Order Management Component: Responsible for tracking the lifecycle of an order from creation to fulfillment.
- Inventory Service Component: Manages stock levels, product availability, and warehouse data.
- Payment Gateway Component: Interfaces with external banking systems to process transactions securely.
- Notification Service Component: Sends emails or SMS confirmations to customers regarding order status.
Interactions and Dependencies
The User Interface component requires the Order Management component to retrieve product details. It also depends on the Payment Gateway to finalize purchases. The Order Management component, in turn, requires the Inventory Service to check stock before confirming an order. This creates a clear chain of dependencies.
Consider the following table which maps out the interface requirements for this scenario:
| Component | Provides | Requires | Dependency Type |
|---|---|---|---|
| User Interface | Display Product List | Place Order, Process Payment | Dependency |
| Order Management | Order Status, Create Order | Check Inventory, Send Notification | Dependency |
| Payment Gateway | Process Transaction | Validate Credentials | Dependency |
This structure allows developers to modify the User Interface without affecting the Payment Gateway, provided the interface contracts remain unchanged. This modularity is the key benefit of using component diagrams.
Real-World Example 2: Banking Application 🏦
Banking systems require a high level of security and reliability. A component diagram here must reflect the strict boundaries between sensitive data and public access points. The architecture often involves microservices or modular monoliths to ensure isolation.
Key Components
- Authentication Component: Handles user login, session management, and multi-factor verification.
- Ledger Component: Manages account balances and transaction history. This is the core data integrity layer.
- Transfer Service Component: Facilitates money movement between accounts.
- Reporting Component: Generates statements and tax documents for regulatory compliance.
Security Considerations
In this context, the Authentication component acts as a gatekeeper. It must be placed such that all other components depend on it for access control. The Ledger component typically does not provide direct access to the public; it is accessed only through the Transfer Service or Reporting components.
Visualizing this hierarchy helps students understand how security policies are enforced at the architectural level rather than just within code blocks. The component diagram shows that the Transfer Service requires the Ledger, but the Reporting component might also require the Ledger for data retrieval.
Interface Contracts
Strict interfaces are vital in banking. For example, the Transfer Service might require an interface named IBankLedger. This ensures that any underlying implementation of the ledger must adhere to specific methods for debiting and crediting funds. If the implementation changes, the interface contract ensures the Transfer Service remains compatible.
Real-World Example 3: IoT Sensor Network 📡
Internet of Things (IoT) applications present unique challenges regarding connectivity and data flow. A component diagram for an IoT system highlights the distinction between edge devices and cloud infrastructure.
System Architecture
- Device Component: Represents the physical hardware sensors (temperature, motion, etc.).
- Gateway Component: Aggregates data from multiple devices and manages local communication protocols.
- Cloud Storage Component: Stores historical data for long-term analysis.
- Analytics Engine Component: Processes data to identify patterns or trigger alerts.
Communication Flow
The Device component requires the Gateway component to transmit data. The Gateway component, in turn, depends on the Cloud Storage component to persist information. This separation allows the Device component to remain lightweight, offloading heavy processing to the Gateway and Cloud.
A common pitfall in IoT modeling is failing to represent the network limitations. The component diagram should indicate that the Gateway has a dependency on the Cloud Storage, but this dependency might be intermittent or asynchronous. This informs students that not all dependencies imply synchronous blocking calls.
Best Practices for Students 📝
Creating effective component diagrams requires discipline. Students often rush to draw boxes and lines without thinking about the underlying architecture. The following guidelines will help improve the quality of your work.
1. Focus on Granularity
A component should represent a logical unit of implementation. If a component is too small (e.g., a single class), it is better represented in a class diagram. If it is too large (e.g., the entire system), it lacks detail. Aim for a level where a component corresponds to a deployable artifact.
2. Define Clear Interfaces
Never assume a connection exists without defining how it happens. Every line connecting two components should represent a specific interface. Avoid using generic lines that imply a direct code dependency without a defined contract.
3. Maintain Consistency
Use standard notation for ports and interfaces. If you choose to label a provided interface as “Service A,” ensure it is labeled consistently across all diagrams in the project. Consistency reduces cognitive load for anyone reading the documentation.
4. Separate Concerns
Do not mix business logic with infrastructure concerns in the same component unless necessary. For example, keep data access logic separate from user interface logic. This separation makes it easier to test and deploy individual parts of the system.
Common Mistakes to Avoid ⚠️
Even experienced designers make errors. Being aware of these common pitfalls can save time during code reviews and system design sessions.
- Over-Complexity: Drawing every single class as a component creates a diagram that is impossible to read. Stick to high-level modules.
- Missing Interfaces: Connecting components directly without an interface line suggests a tight coupling that is hard to refactor. Always define the interface.
- Ignoring Deployment: A component diagram is often used alongside a deployment diagram. Ensure that the components in your model map to actual files or containers in the deployment environment.
- Confusing Class and Component: Remember that a component is a runtime unit, while a class is a compile-time unit. A single component can contain many classes.
Comparison: Component vs. Class Diagrams 📊
Students often confuse component diagrams with class diagrams. While both describe structure, they serve different purposes. The table below clarifies the distinctions.
| Feature | Class Diagram | Component Diagram |
|---|---|---|
| Level of Abstraction | Low (Code level) | High (Architecture level) |
| Primary Focus | Attributes and Methods | Interfaces and Dependencies |
| Runtime Visibility | Static Structure | Dynamic Interaction |
| Deployment | Not explicitly shown | Often maps to deployable units |
Using the correct diagram at the right stage of the software development lifecycle is critical. Class diagrams are used during detailed design and coding. Component diagrams are used during system design and integration planning.
Integration with the Development Lifecycle 🔄
Component diagrams are not static documents; they evolve with the software. In the requirements phase, they help identify high-level modules. During design, they refine the interfaces. During implementation, they guide the folder structure and module organization.
When a new feature is added, the component diagram should be updated to reflect the new dependency. This practice, known as “living documentation,” ensures that the architecture remains accurate. If the diagram is not updated, it becomes misleading and loses its value.
Conclusion
Mastering component diagrams is a significant step toward becoming a proficient software engineer. By understanding how to model components, interfaces, and dependencies, you gain the ability to design systems that are robust, scalable, and maintainable. The real-world examples provided here illustrate how these concepts apply to diverse domains, from e-commerce to finance and IoT.
Remember that the goal of these diagrams is communication. Whether you are presenting to a team or documenting for future maintenance, clarity is paramount. Avoid unnecessary complexity, focus on the interfaces that matter, and ensure your models reflect the actual runtime behavior of the system. With practice, these diagrams will become an intuitive part of your design process.

