


Software architecture forms the backbone of any scalable application. As a computer science student, understanding how to model system structure is just as important as writing the code itself. Among the Unified Modeling Language (UML) notations, the component diagram holds a unique position. It bridges the gap between high-level design and implementation details. This guide breaks down the essentials you need to master component diagrams for your academic and professional future.
Understanding the Component Concept 🧩
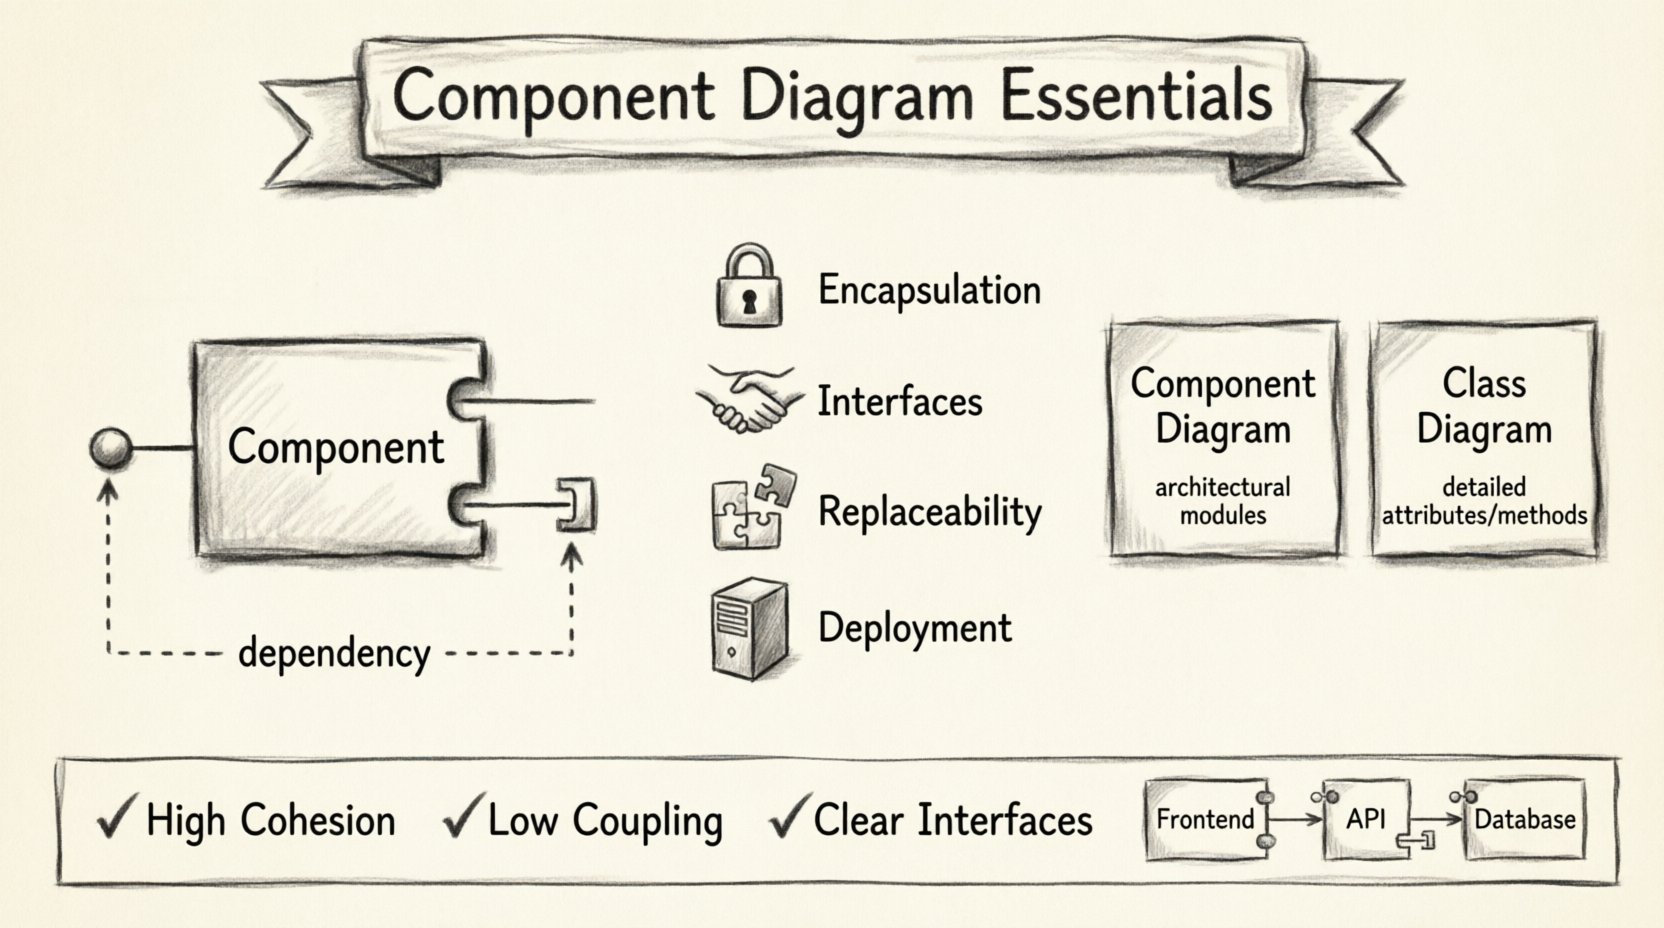
A component represents a modular part of a system. It encapsulates implementation details and exposes functionality through interfaces. In the context of software engineering, components are the building blocks of a larger system. They are replaceable and independent units that interact with other parts of the architecture.
For students, visualizing these units helps in decomposing complex problems. Instead of viewing a system as a single monolithic block, you see it as a collection of distinct responsibilities. This aligns with the principles of separation of concerns.
Key Characteristics of Components
- Encapsulation: Internal logic is hidden from the outside world.
- Interfaces: Defined contracts for interaction (provided or required).
- Replaceability: One component can be swapped for another if interfaces match.
- Deployment: Components often map to physical deployment units like JAR files or DLLs.
Unlike classes, which focus on data structures and methods, components focus on the runtime structure. They allow you to abstract away the complexity of individual classes into manageable units.
The Anatomy of a Component Diagram 📐
Creating a clear diagram requires understanding the specific symbols used. Each symbol carries specific semantic meaning regarding how the system operates. Here are the core elements you must recognize.
1. Component Icons 📦
The standard icon for a component is a rectangle with two small rectangles on the left side. These tabs represent the interface ports or connections. When drawing these by hand or using generic tools, ensure the shape is distinct from class boxes to avoid confusion.
2. Interfaces ⚙️
Interfaces are the primary mechanism of interaction. They define what a component can do or what it needs. There are two types to track:
- Provided Interface: The services the component offers to others. This is often drawn as a “lollipop” symbol (a circle attached to the component).
- Required Interface: The services the component needs from others. This is often drawn as a “socket” symbol (a half-circle attached to the component).
3. Ports 🔌
Ports are specific points of interaction on a component. While often synonymous with interfaces in high-level diagrams, ports can represent physical or logical connection points. In student projects, treating a port as a specific entry point for data or control flow is a good practice.
4. Dependencies 🔗
Dependencies show how components rely on one another. These relationships are critical for understanding the flow of data and control. A dependency line usually ends with an open arrow pointing toward the supplier component.
Relationships and Dependencies 🔗
Understanding how components connect is the most technical part of this guide. Incorrect relationships lead to tight coupling and fragile systems. Below are the primary relationship types you will encounter.
Dependency
This is the most common relationship. It indicates that a change in one component may affect the other. It does not imply a strong structural link, just a usage relationship.
- Usage: Component A uses an operation in Component B.
- Realization: Component A implements an interface provided by Component B.
Association
Associations represent structural links. If Component A holds a reference to Component B, an association exists. This implies a stronger connection than a dependency. In component modeling, associations often represent the physical wiring of a system.
Generalization
This relationship indicates inheritance or specialization. If Component A is a specific type of Component B, a generalization arrow points from A to B. This is useful for defining frameworks or plugin architectures.
Comparison of Relationship Types
| Relationship | Strength | Usage Context |
|---|---|---|
| Dependency | Weak | Temporary usage, service calls |
| Association | Strong | Long-term structural links |
| Realization | Structural | Interface implementation |
| Generalization | Inheritance | Polymorphism and hierarchy |
Component vs. Class Diagrams 🆚
Students often confuse component diagrams with class diagrams. While both model structure, they operate at different levels of abstraction. Knowing when to use which is vital for accurate documentation.
- Class Diagram: Focuses on data, attributes, and methods. It is static and implementation-heavy. It shows how objects behave at runtime.
- Component Diagram: Focuses on modules, libraries, and deployment units. It is architectural and high-level. It shows how parts of the system fit together.
Use a class diagram when designing the internal logic of a specific module. Use a component diagram when designing the overall system architecture or explaining the system to stakeholders who do not care about internal code details.
Granularity and Abstraction Levels 📊
One of the most common mistakes students make is choosing the wrong level of granularity. A component is neither too small nor too large. It must be meaningful.
Defining Appropriate Size
If a component represents a single class, it is too granular. You lose the benefit of encapsulation. If a component represents the entire application, it is too abstract. It offers no insight into the structure.
Good components typically encapsulate a cohesive set of classes. Think of a “Payment Service” component rather than a “PaymentProcessor” class. The component should be deployable independently.
Subsystems
For large systems, you can nest components within subsystems. This creates a hierarchy. A subsystem acts as a container for related components. This helps in managing complexity by grouping functionalities like “Authentication,” “Reporting,” or “Data Access.”
Design Principles for Students 📝
Applying design principles ensures your diagrams are not just pictures, but useful engineering artifacts. Follow these guidelines to improve the quality of your modeling.
1. High Cohesion
Keep related functionality within the same component. If a component handles database connections and user interface rendering, it has low cohesion. Split these into “Data Layer” and “Presentation Layer” components.
2. Low Coupling
Minimize dependencies between components. If Component A changes, Component B should not break. Rely on interfaces to define interactions. This makes the system easier to maintain and test.
3. Clear Naming Conventions
Names should be descriptive and consistent. Use nouns for components (e.g., “OrderManager”) and verbs for interfaces (e.g., “ProcessOrder”). This reduces ambiguity during code reviews.
4. Consistent Notation
Stick to the standard UML notation. Do not invent new shapes or symbols. If you use a lollipop for a provided interface, use it consistently across the entire diagram. This ensures other developers can read your work.
Common Pitfalls ⚠️
Even experienced developers make mistakes in modeling. Be aware of these common errors to avoid them in your own work.
- Over-Complication: Trying to model every single class in a component diagram. This defeats the purpose of abstraction. Focus on the major modules.
- Missing Interfaces: Drawing lines between components without defining interfaces. This implies direct coupling, which is bad practice.
- Ignoring Deployment: Component diagrams often map to deployment diagrams. If you define a component, consider where it runs (e.g., client, server, database).
- Static vs. Dynamic: Do not use component diagrams to show the flow of time. For sequence of events, use sequence diagrams. Component diagrams show structure, not behavior.
Integration with Other Diagrams 🔗
Component diagrams do not exist in isolation. They interact with other UML views to provide a complete picture of the system.
Deployment Diagrams
Deployment diagrams show the physical hardware. Component diagrams show the software artifacts. A component is deployed onto a node in the deployment diagram. Understanding this link helps you visualize how software runs on infrastructure.
Package Diagrams
Packages group related elements. Components often reside inside packages. A package diagram can show the organization of components before you dive into the detailed component diagram. Use packages to manage namespace collisions.
Class Diagrams
A component typically contains a set of classes. While the component diagram shows the “box,” the class diagram shows the “contents.” Ensure that the classes inside a component match the responsibilities defined in the component interface.
Best Practices for Documentation 📖
Documentation is about communication. Your diagrams should tell a story to the reader.
- Use Annotations: Add notes to explain complex dependencies or specific constraints. Text is sometimes necessary when symbols are ambiguous.
- Keep it Updated: A diagram that is out of date is worse than no diagram. Treat documentation as a living artifact.
- Group Related Diagrams: If you have multiple components, use a context diagram first. This shows the system as a single block interacting with external actors. Then zoom in to the internal components.
Real-World Application Examples 💡
To solidify your understanding, consider how these diagrams apply to real scenarios.
Web Application Architecture
In a web app, you might have distinct components for:
- Frontend: Handles user interaction.
- Backend API: Handles business logic.
- Database: Handles persistence.
Each component exposes specific interfaces. The Frontend requires the API interface. The API requires the Database interface. This separation allows you to update the database without changing the frontend.
Microservices Architecture
Microservices rely heavily on component thinking. Each service is a deployable component. The diagram shows the service boundaries and the communication protocols (HTTP, gRPC, etc.) between them.
Summary of Key Takeaways 🎯
Component diagrams are essential tools for software architects and developers. They allow you to reason about system structure without getting lost in code details. For a CS student, mastering this notation demonstrates a maturity in thinking about systems.
Remember these core points:
- Components are modular, replaceable units with defined interfaces.
- Interfaces (provided/required) are the contracts for interaction.
- Dependencies should be minimized to reduce coupling.
- Use components for high-level architecture, not detailed logic.
- Consistency in notation is key for team collaboration.
By focusing on modularity and clear boundaries, you build systems that are easier to understand, test, and evolve. Use component diagrams as a communication tool to bridge the gap between design and implementation. This skill will serve you well in both academic projects and professional engineering roles.

