In the world of Scrum, data is often seen as a double-edged sword. On one side, it provides clarity on progress and health. On the other, it can become a source of anxiety or manipulation. The goal is not to measure everything, but to measure what matters. Many teams struggle because they focus on output rather than outcome, or they track metrics that incentivize the wrong behaviors.
This guide explores how to select and implement Agile metrics that foster genuine improvement. We will move beyond vanity statistics to find data points that help teams understand their workflow, identify bottlenecks, and deliver value consistently. By focusing on the right indicators, you create a culture of transparency and continuous learning.
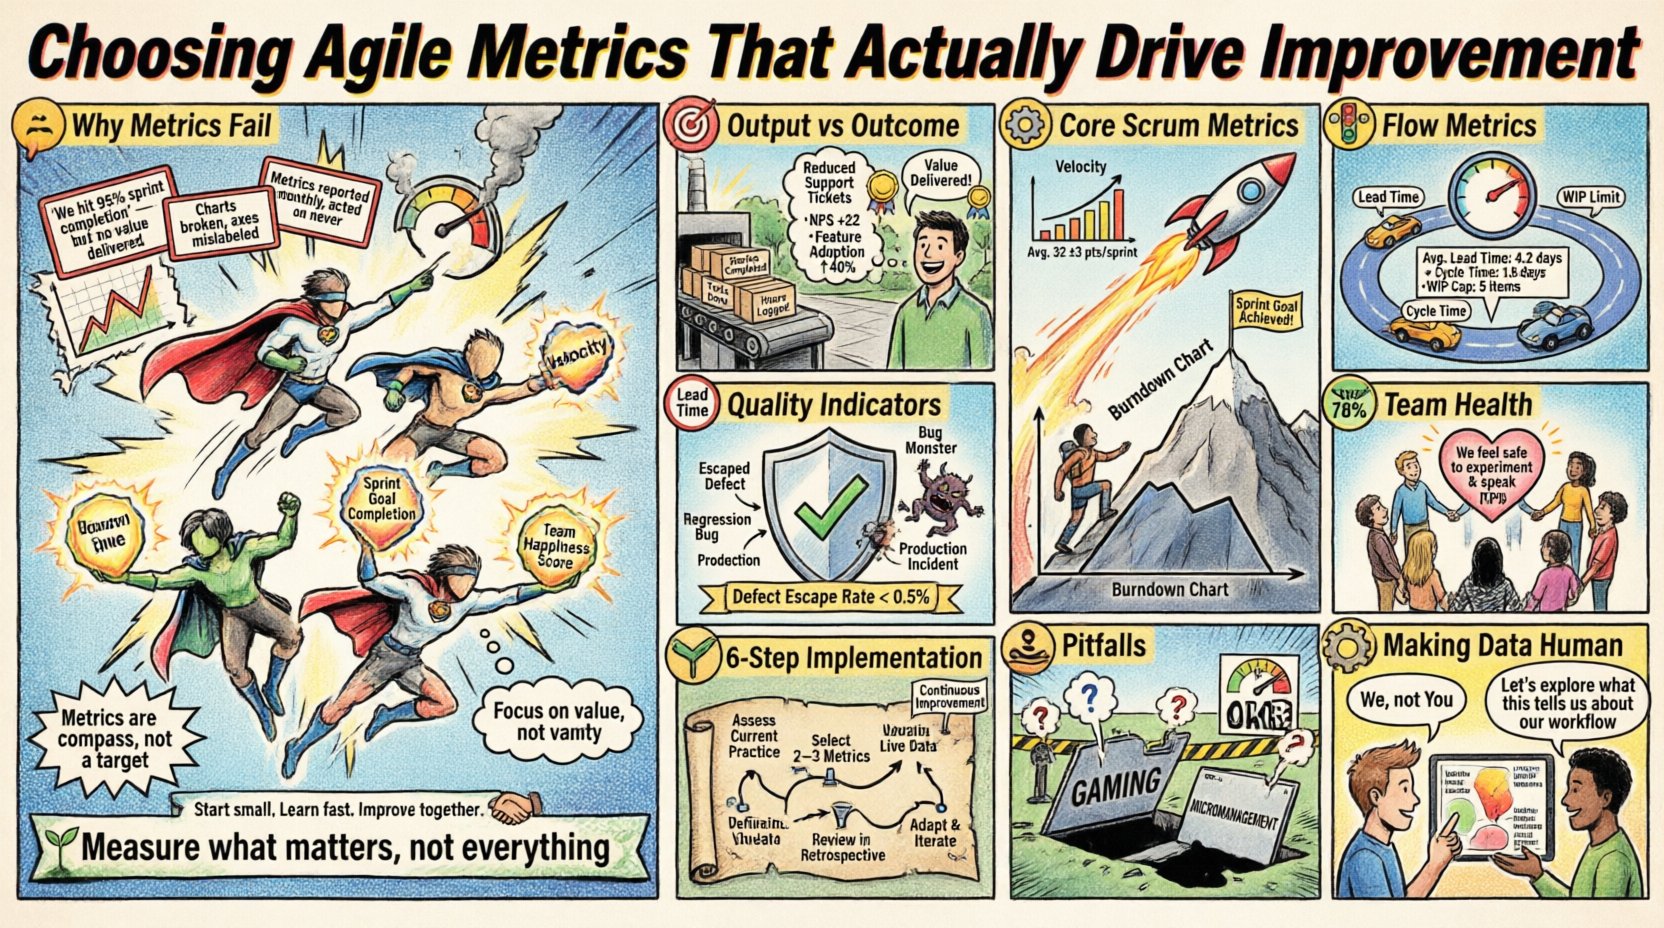
Why Metrics Often Fail to Deliver Value 🛑
Before selecting specific numbers, it is crucial to understand why measurement initiatives frequently fall flat. The most common reason is a lack of clear intent. When a team is told to track a metric without understanding why, the metric becomes a target rather than a compass.
- Measurement for Control: If leadership uses metrics to micromanage, trust erodes. Teams will optimize for the number, not the work.
- Output vs. Outcome: Counting lines of code or story points completed tells you nothing about whether the software solves a user problem.
- Lagging Indicators: Metrics that only show past performance do not help predict future issues. Teams need leading indicators to adjust course.
- Too Many Metrics: Monitoring ten different dashboards creates noise. Focus on a few key signals that drive decision-making.
To succeed, metrics must be treated as feedback mechanisms. They are meant to be discussed in retrospectives, not used for performance reviews. When the purpose is improvement, the data becomes a tool for the team, not a weapon against them.
Defining Value and Improvement 🎯
Before adopting any metric, the team must agree on what constitutes improvement. Is it speed? Quality? Customer satisfaction? Stability? Without this alignment, metrics become meaningless.
Output Metrics
Output metrics measure the work completed. They are useful for capacity planning but do not guarantee value.
Outcome Metrics
Outcome metrics measure the impact of the work on the customer or business.
- User Adoption Rates
- Customer Satisfaction Scores (CSAT)
- Revenue Generated
- Reduction in Support Tickets
A balanced approach combines both. You need to know how much you are building (output) and whether it is working (outcome). However, for day-to-day Scrum execution, flow and quality metrics often provide more immediate feedback than business outcomes, which can take weeks to materialize.
Core Scrum Metrics Explained ⚙️
Scrum provides a framework for managing work. Several standard metrics have emerged to support this framework. These are not mandates, but proven tools for understanding team performance.
Velocity
Velocity measures the amount of work a team completes during a Sprint. It is calculated by summing the story points of completed items. It is primarily used for forecasting, not for comparing teams.
- Use Case: Predicting how many sprints are needed for a backlog.
- Warning: Velocity fluctuates. Do not treat it as a fixed constant.
- Best Practice: Use the average of the last three sprints for planning.
Burndown Chart
A Burndown Chart tracks the remaining work in a Sprint against time. It helps identify if the team is on track to finish the Sprint Goal.
- Upward Trend: Indicates scope creep or new work added mid-sprint.
- Flat Line: Suggests a blockage or lack of progress.
- Downward Trend: Shows steady progress toward completion.
Comparison of Common Scrum Metrics
| Metric | Primary Purpose | Frequency | Risk Level |
|---|---|---|---|
| Velocity | Forecasting Capacity | Per Sprint | Medium (if misused for comparison) |
| Burndown | Track Sprint Progress | Daily | Low |
| Release Burnup | Track Release Scope | Weekly | Low |
| Escaped Defects | Quality Assessment | Per Release | High (if used punitively) |
Flow Metrics for Predictability 🚦
While Scrum focuses on time-boxed iterations, Flow Metrics focus on the movement of work through the system. These are essential for identifying bottlenecks and improving throughput.
Lead Time
Lead Time is the total time from when a request is made until it is delivered. This measures the customer experience directly.
- Short Lead Time: Indicates high responsiveness.
- Long Lead Time: Suggests delays in backlog refinement or deployment.
- Goal: Reduce variability to make delivery dates predictable.
Cycle Time
Cycle Time measures the time from when work actually begins until it is done. This excludes the wait time in the backlog.
- Insight: Helps identify process inefficiencies.
- Optimization: If cycle time is high, look at work-in-progress (WIP) limits.
- Comparison: Shorter cycle times often correlate with higher quality due to faster feedback loops.
Cumulative Flow Diagram (CFD)
A CFD visualizes the status of work items over time. It shows how much work is in each state (To Do, In Progress, Done).
- Bottleneck Detection: A widening band indicates a blockage in that stage.
- WIP Visibility: Helps enforce WIP limits by showing accumulation.
- Flow Efficiency: The ratio of value-added time to total time.
Quality and Health Indicators 🛡️
Speed without quality is unsustainable. Teams must track metrics that ensure the system remains stable and maintainable.
Defect Rate
Track the number of bugs found per release or per story point. A rising trend indicates technical debt is accumulating or testing is insufficient.
- Escaped Defects: Bugs found by users after release.
- First Pass Yield: Percentage of items that pass testing without rework.
Technical Debt Ratio
Measure the effort spent on maintenance versus new features. A healthy team should dedicate a portion of every sprint to paying down debt.
- Monitoring: Track the percentage of capacity allocated to refactoring.
- Impact: High debt leads to slower velocity over time.
Sprint Goal Success Rate
This measures how often the team achieves its commitment for the Sprint. It reflects planning accuracy and scope management.
- High Success: Indicates good estimation and focus.
- Low Success: Suggests scope creep or external interruptions.
Team Health and Satisfaction 🧘
The people behind the code are the most important variable. Metrics that ignore human factors often lead to burnout and turnover.
- NPS (Net Promoter Score) for Teams: Ask team members how likely they are to recommend the team to others.
- Retention Rate: High turnover disrupts flow and knowledge transfer.
- Meeting Load: Track the percentage of time spent in meetings versus deep work.
- Workload Balance: Ensure no single individual is consistently overloaded.
These metrics are often qualitative. Use surveys or regular check-ins to gather this data. A happy team produces better work. If the numbers look good but morale is low, something is wrong.
Implementing a Measurement Strategy 🗺️
Introducing new metrics requires a structured approach. Do not introduce everything at once. Follow these steps to ensure adoption and utility.
Step 1: Identify the Problem
Start with a specific pain point. Are releases taking too long? Is quality slipping? Choose metrics that address that specific issue. If the problem is unknown, do not measure.
Step 2: Define the Baseline
Record current performance before making changes. This provides a reference point to measure improvement against.
Step 3: Select a Few Key Metrics
Limit the dashboard to three to five metrics. Too many signals create paralysis. Select one flow metric, one quality metric, and one team health metric.
Step 4: Visualize and Share
Display metrics where the team can see them daily. Use physical boards or shared digital dashboards. Visibility creates accountability without management intervention.
Step 5: Review in Retrospectives
Make the data a topic of discussion. Ask: “What does this trend tell us?” “How can we improve this number?” This turns data into action.
Step 6: Iterate and Prune
After a few months, review the metrics. If a metric is not driving conversation or change, stop measuring it. Stop wasting time on vanity data.
Pitfalls to Avoid ⚠️
Even with the best intentions, measurement can go wrong. Be vigilant against these common traps.
Gaming the System
If a team knows their performance is judged by a metric, they will optimize for that metric, often at the expense of the real work. For example, if story points are the goal, teams may inflate point estimates. Always focus on the outcome, not the input.
Micromanagement
Management should not use metrics to police the team. Metrics are for the team to use. If a manager checks a dashboard to find faults, the team will hide data.
Ignoring Context
Numbers do not tell the whole story. A drop in velocity might be due to a complex refactor, not poor performance. Context is king. Always discuss the “why” behind the numbers.
Chasing Vanity Metrics
Metrics that look good but mean nothing should be discarded. For example, the number of commits does not equal progress. Focus on value delivery.
Making Data Human 👥
Data is cold; people are warm. The goal of measurement is to support people, not replace judgment. When presenting metrics, frame them as observations, not verdicts.
- Use “We” instead of “You”: “We are seeing a trend in cycle time” vs “You are slow.”
- Encourage Curiosity: Ask questions rather than making statements.
- Protect Privacy: Do not share individual performance data publicly.
- Focus on Systems: Blame the process, not the person. If the metric is bad, change the process.
Final Thoughts on Measurement 🌱
Choosing Agile metrics is an exercise in discipline. It requires the courage to stop measuring what doesn’t matter and the wisdom to focus on what does. There is no silver bullet. Every team is different.
Start small. Pick one metric that hurts. Measure it. Discuss it. Improve it. Repeat. Over time, the data will tell a story about how your team learns and grows. Remember, the metric is not the goal. The goal is the value you deliver to your customers. Let the numbers guide you, but never let them drive the car.
Frequently Asked Questions ❓
Can I compare velocity between teams?
No. Story points are relative to the team. Team A’s point may equal Team B’s five points. Comparing velocity is like comparing apples to oranges.
How often should we review metrics?
Review flow metrics weekly during the Sprint. Review quality and outcome metrics monthly or per release. Daily reviews are for tracking current Sprint progress.
What if the team resists measurement?
Involve them in the selection process. If they feel ownership over the metrics, they will care more about the data. Explain the benefit to them, not just to management.
Do we need tools to track these metrics?
Not necessarily. A spreadsheet or a physical board can track velocity and burndown. Tools are helpful for flow metrics like Cycle Time, but manual tracking is valid for simple needs.
How do we handle external interruptions?
Track them separately. Use a metric for “Interruption Rate” to see how much capacity is lost to unplanned work. This helps management understand the cost of context switching.

