Component diagrams serve as a cornerstone in software architecture documentation, particularly within academic research and thesis submissions. They provide a structural view of the system, illustrating how logical units interact to deliver functionality. However, creating these diagrams requires precision. In an academic setting, a diagram is not merely an illustration; it is evidence of architectural understanding. Misinterpretations or technical inaccuracies can undermine the validity of the research findings.
This guide explores frequent mistakes encountered when designing component diagrams for scholarly work. By identifying these pitfalls early, researchers can ensure their documentation meets rigorous academic standards. The focus remains on clarity, correctness, and adherence to standard modeling conventions without relying on specific proprietary tools.
1. Granularity and Scope Ambiguity 🎯
One of the most prevalent issues in academic diagrams is the inconsistent level of detail. Granularity refers to the size and scope of the components depicted. If a component is too broad, it obscures internal logic. If it is too narrow, the diagram becomes cluttered and loses its high-level overview purpose.
Defining Component Boundaries
- Too High Level: Defining a component as “The System” or “The Database” provides no insight into the architecture. It fails to show distinct responsibilities.
- Too Low Level: Representing individual methods or classes as components defeats the purpose of a component diagram. This belongs in class diagrams.
- Optimal Level: Components should represent logical groupings of functionality. For example, “Authentication Service” is preferable to “Login Form” or “Entire Application”.
Implications for Academic Review
Examiners look for evidence of separation of concerns. If the granularity is ambiguous, it suggests the author has not fully decomposed the system. This can lead to questions regarding the modularity of the proposed solution.
2. Interface Definition Mistakes 🔌
Interfaces are the contract between components. They dictate how one part of the system communicates with another. Errors here often stem from confusion between provided and required interfaces, or the misuse of realization relationships.
Provided vs. Required Interfaces
- Provided Interfaces: These are capabilities that a component offers to others. Visually, these are often depicted as lollipop symbols or explicitly named interfaces with a stereotype like <<provided>>.
- Required Interfaces: These are the services a component needs to function. Visually, these are sockets or explicitly named interfaces with a stereotype like <<required>>.
Common Error: Connecting two components directly without an interface. This implies an internal dependency rather than a contractual one.
Realization Relationships
When a component implements an interface, a specific relationship type must be used. Using a simple association line to denote implementation is technically incorrect and confuses the dependency type. In academic contexts, this distinction demonstrates a deeper understanding of UML semantics.
3. Dependency Direction and Cycles 🔄
Dependencies define the flow of control and data. In component diagrams, arrows indicate that one component relies on another. Getting the direction wrong fundamentally alters the meaning of the architecture.
Directional Accuracy
- Source to Target: The arrow should point from the client (the component needing the service) to the supplier (the component providing the service).
- Common Mistake: Drawing arrows from the provider to the consumer. This suggests the provider depends on the consumer, which is often logically inverted.
Avoiding Circular Dependencies
Circular dependencies occur when Component A depends on Component B, and Component B depends on Component A. In a physical system, this creates a deadlock or a compilation error. In a diagram, it represents a design flaw.
- Impact: High coupling reduces maintainability. It makes it difficult to update one part of the system without affecting the other.
- Academic Consequence: Reviewers may flag this as a lack of decoupling. It suggests the system is monolithic rather than modular.
4. Naming Conventions and Semantics 🏷️
Labels on diagrams carry significant weight. They are the primary source of information when reading the visual model. Inconsistent or vague naming conventions reduce the document’s readability.
Descriptive Component Names
- Generic Labels: Avoid names like “Part 1”, “Module A”, or “Thing”. These provide zero semantic value.
- Functional Labels: Use names that describe the responsibility. “Payment Processor” is better than “Payment Module”.
- Consistency: If you use the suffix “Service” for one component, do not use “Manager” for another with the same function. Standardize across the entire diagram.
Interface Naming
Interface names should indicate the action or capability. Instead of “Interface 1”, use “DataAccessInterface”. This allows the reader to understand the contract without digging into the component internals.
5. Association and Aggregation Confusion 🔗
Relationships between components must be precise. Confusing association, aggregation, and composition can lead to misunderstandings about lifecycle management and ownership.
Understanding the Differences
- Association: A generic link. It implies a relationship but not necessarily ownership or lifecycle dependency.
- Aggregation: A “whole-part” relationship where the part can exist independently of the whole. Visually, a hollow diamond.
- Composition: A stronger form of aggregation where the part cannot exist without the whole. Visually, a filled diamond.
Common Errors in Diagrams
- Overusing Composition: Using filled diamonds for all relationships. This implies that if the main component is destroyed, all sub-components are destroyed, which is not always true in distributed systems.
- Missing Multiplicity: Failing to indicate cardinality (e.g., 1 to 1, 1 to many) can obscure the scale of the interaction.
- Using Class Diagram Symbols: Component diagrams should not use the inheritance triangles (generalization) unless specifically modeling interface inheritance. Confusing generalization with dependency is a common error.
6. Visual Layout and Readability 📐
A technically accurate diagram is useless if it is visually chaotic. Academic papers require diagrams that can be scanned quickly to understand the system flow.
Layout Principles
- Flow Direction: Arrange components to suggest a logical flow, typically left-to-right or top-to-bottom. Avoid crisscrossing lines where possible.
- Grouping: Use boundaries or packages to group related components. This reduces cognitive load.
- Crossing Lines: Minimize the number of times dependency lines cross each other. Use orthogonal routing (right angles) rather than diagonal lines for better clarity.
Clutter Reduction
Do not include every single relationship. If a dependency is trivial or implied by the architecture, it may be omitted to maintain focus on the critical paths. Including every possible link often creates a “spaghetti diagram” that is impossible to interpret.
Comparison of Common Errors
| Category | Common Error | Consequence | Correction |
|---|---|---|---|
| Granularity | Component represents a single method | Diagram becomes too detailed; loses architectural view | Group methods into logical units (e.g., Service) |
| Interfaces | Direct connection without interface symbol | Hides the contract; increases coupling | Insert interface lollipop or socket symbols |
| Dependencies | Arrow points from Provider to Consumer | Reverses the meaning of dependency | Point arrow from Client to Supplier |
| Naming | Generic names like “Part A” | Reader cannot infer functionality | Use functional names (e.g., “Auth Module”) |
| Relationships | Using inheritance for implementation | Confuses class and component semantics | Use realization (dashed line with hollow triangle) for interfaces |
| Layout | Crossing dependency lines everywhere | Difficult to trace logic flow | Use orthogonal routing and grouping |
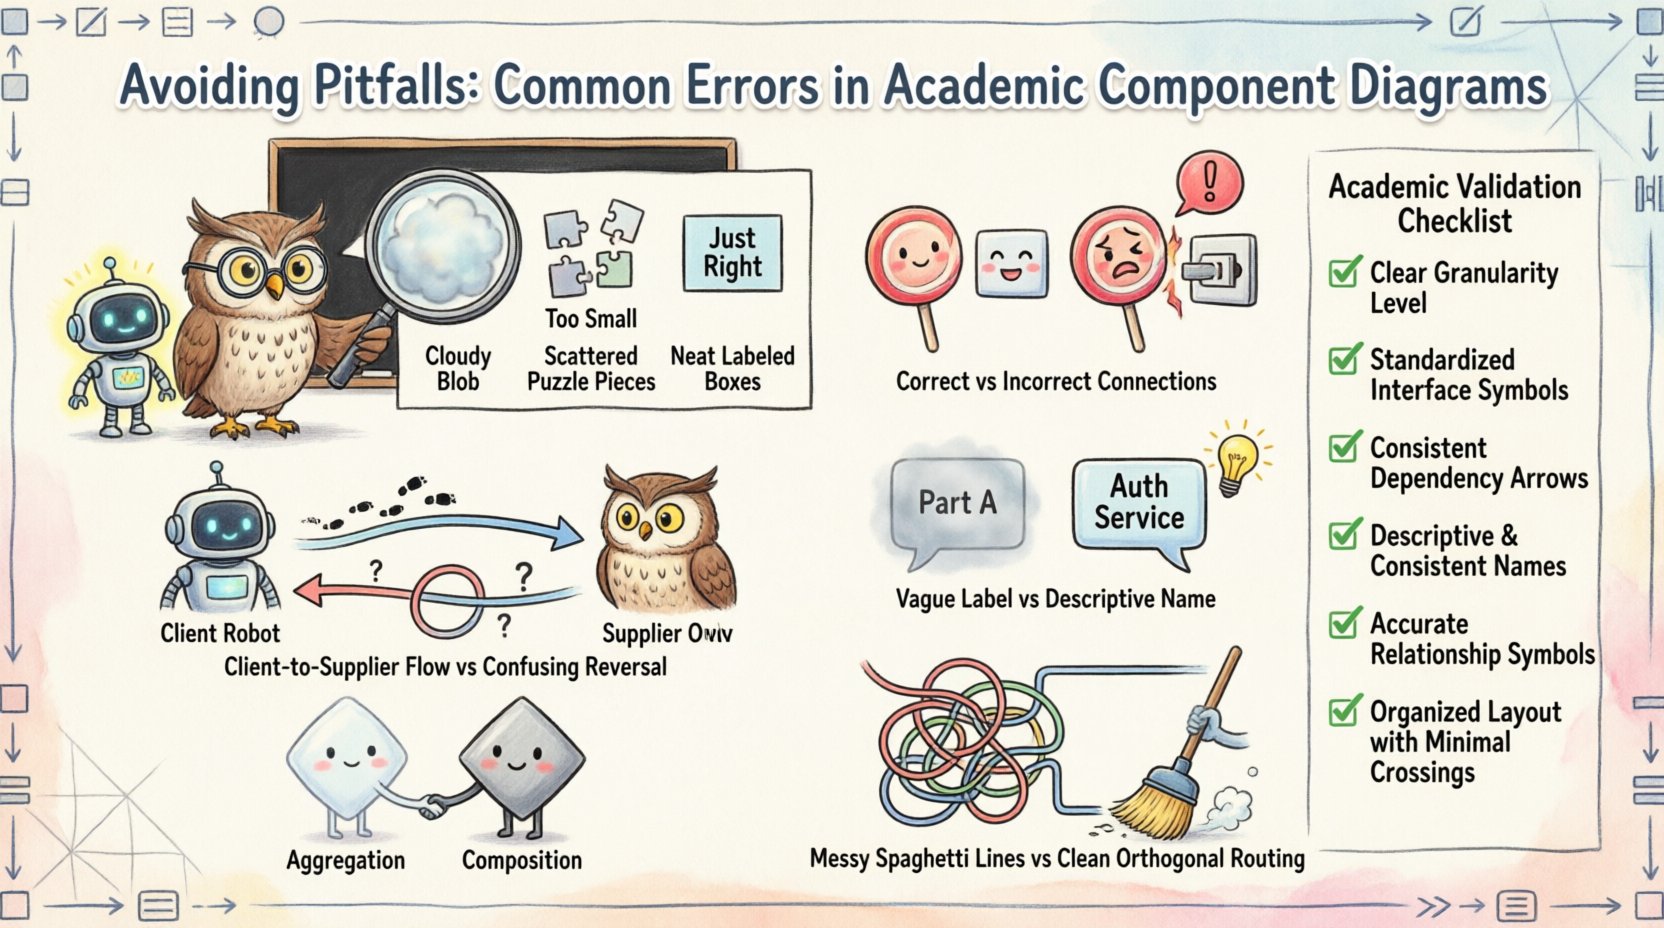
7. Academic Validation Checklist ✅
Before submitting a thesis or paper, perform a rigorous review of the component diagram. Use this checklist to ensure all technical and stylistic requirements are met.
- Completeness: Does the diagram cover all major subsystems described in the text? Are there missing components that the text references?
- Consistency: Do the names in the diagram match the terminology used in the narrative sections of the document?
- Accuracy: Are all arrows pointing in the correct direction? Do the relationship symbols (lollipop, socket, diamond) match the intended semantics?
- Clarity: Can a peer read the diagram and understand the high-level architecture without reading the entire document?
- Standard Compliance: Does the diagram adhere to the modeling standard required by the institution (e.g., UML 2.x)?
- Accessibility: Are the labels large enough to read when the figure is scaled down for publication?
- Version Control: Ensure the diagram version matches the code version or system state described in the research.
8. Documentation and Contextualization 📝
A diagram does not exist in isolation. In academic writing, it must be supported by descriptive text. The diagram visualizes the structure, while the text explains the behavior and rationale.
Referencing the Diagram
Always reference the diagram in the main text before it appears. For example: “Figure 1 illustrates the component structure, highlighting the separation between the presentation layer and the business logic layer.” This primes the reader for what they are about to see.
Explaining Complex Relationships
If a relationship is complex, such as a remote dependency or a specific protocol interface, add a callout or a legend. Do not rely solely on the visual symbols to convey technical constraints. Text annotations can clarify that a connection represents a network socket rather than a local method call.
Handling Abstraction
It is acceptable to abstract away details that are not relevant to the specific research contribution. However, note this in the figure caption. If the diagram omits the caching layer for the sake of simplicity, state that in the caption: “The caching layer is omitted for clarity as it does not affect the core architectural contribution.”
9. Semantic Integrity in Research 🎓
Academic rigor extends beyond the visual correctness of the diagram. It extends to the semantic integrity of the model. This means the diagram must truthfully represent the system it claims to describe.
Truthfulness
- Do not draw a diagram that looks “better” than the actual implementation if the research is about the implementation itself. Inaccuracies in the model invalidate the empirical data.
- If the system evolved during the research, ensure the diagram reflects the final state, not the initial design.
Consistency with Code
While the diagram does not need to be byte-for-byte identical to the code, the structure must align. If the code uses a Microservices architecture, the diagram should not show a Monolithic structure. Discrepancies between the model and the artifact raise red flags for reviewers.
10. Final Review for Technical Precision 🔍
The final step before inclusion in a manuscript is a technical audit. This involves checking the diagram against the modeling rules one last time.
- Check Stereotypes: Are <<component>> stereotypes used consistently? Are they necessary, or is the default notation sufficient?
- Check Multiplicity: Are the numbers indicating quantity (e.g., 1, 0..*, 1..*) placed correctly on association lines?
- Check Visibility: If showing public vs. private interfaces, ensure the standard symbols (+, -, #) are used correctly if visibility is part of the model.
- Check File Format: Ensure the exported image is high resolution (300 DPI minimum) for publication standards.
By adhering to these guidelines, the component diagram becomes a robust asset in the academic submission. It moves from being a decorative element to a core piece of evidence that supports the research hypothesis. Precision in modeling reflects precision in thought.

