


In the landscape of Agile and Scrum methodologies, few concepts generate as much confusion and anxiety as velocity. Often treated as a performance scorecard by leadership or a rigid target by teams, this metric frequently misses its original intent. Velocity is a tool for the team, not a whip for the manager. When understood correctly, it offers insight into capacity and predictability. When misunderstood, it distorts behavior and erodes trust.
This guide explores the true nature of velocity, how it functions within a Scrum framework, and the critical boundaries that keep it healthy. We will navigate the technical definitions, the common pitfalls that lead to misinterpretation, and the strategies for using data to improve flow without compromising psychological safety.
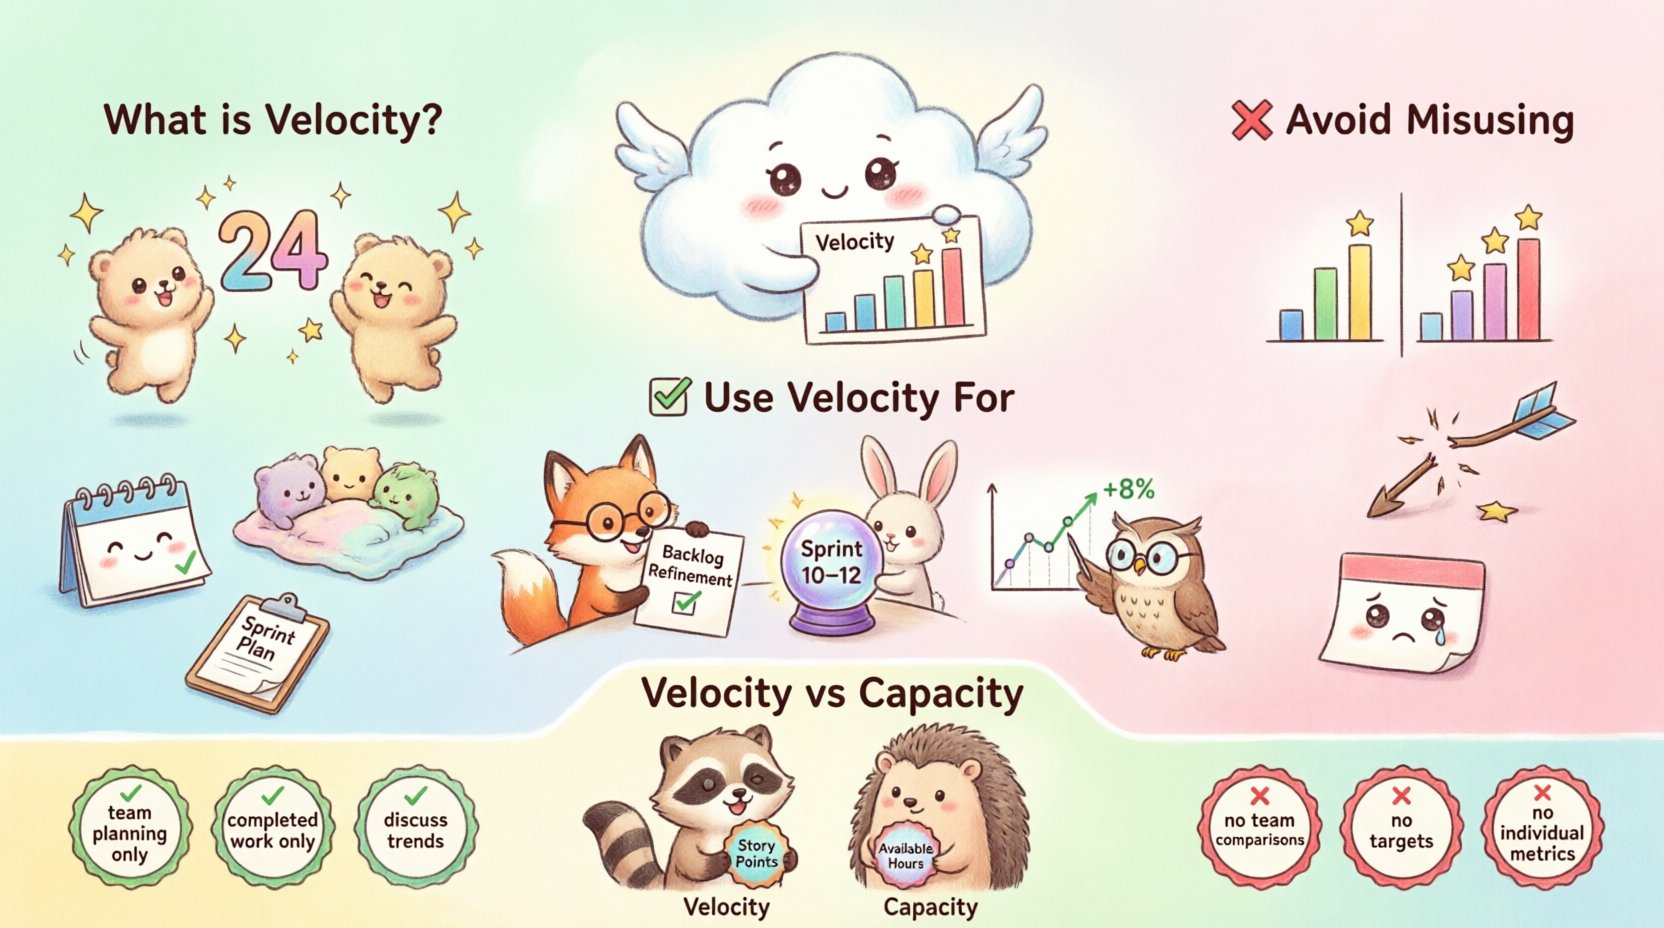
🧩 What is Velocity in Scrum?
At its core, velocity is a measure of the amount of work a Scrum Team can tackle during a single Sprint. It is not a measure of speed in the traditional sense, nor is it a universal standard for productivity. Instead, it is a relative unit of measure derived from the team’s own historical performance.
- It is retrospective: It is calculated based on work completed in past Sprints.
- It is team-specific: It reflects the unique capacity, skill set, and context of one specific group.
- It is a planning aid: Its primary purpose is to help the team forecast how much work they can commit to in the future.
Velocity acts as a stabilizer. Over time, if a team maintains consistency in their definition of done and their estimation techniques, the velocity number tends to stabilize. This stability allows for better product forecasting. However, treating this number as a fixed goal creates friction.
⚙️ How Velocity is Calculated
Understanding the mechanics of calculation is essential to understanding the limitations of the metric. Velocity is typically derived using Story Points. Story points are a relative estimation technique used to gauge the effort, complexity, and risk of a user story.
The Formula
The calculation is straightforward, yet the inputs require discipline:
- Identify all User Stories completed in the Sprint.
- Ensure the Definition of Done (DoD) was met for each item.
- Sum the Story Points assigned to those completed items.
- The resulting total is the velocity for that Sprint.
Crucially, work that was started but not finished does not count. Work that was added late and completed does count. This distinction is vital for maintaining accuracy.
- Completed Work: Only items fully meeting the acceptance criteria contribute to the score.
- Partial Work: Half-finished stories are ignored in the calculation.
- Spikes: Time-boxed research spikes usually do not count towards velocity unless they result in a shippable increment.
- Technical Debt: Refactoring tasks contribute to velocity if they meet the DoD, but they must be balanced against feature work.
🚫 Common Misuses of Velocity
The danger lies not in the metric itself, but in how it is applied by external stakeholders. When velocity is pulled out of context, it becomes a source of pressure rather than a planning tool. Below are the most frequent ways this metric is misapplied.
1. Comparing Teams
One of the most damaging errors is comparing the velocity of Team A against Team B. This comparison is fundamentally flawed because:
- Estimation Scales Differ: Team A might estimate a story as 5 points, while Team B estimates the same story as 8 points based on their own calibration.
- Complexity Varies: One team might work on a legacy system with high technical debt, while another works on a greenfield project.
- Team Composition: A team with a senior architect will move differently than a team of junior developers.
Ranking teams by velocity encourages internal competition and discourages collaboration. It suggests that higher numbers are better, which incentivizes inflating points.
2. Setting Targets
Management often tries to set velocity targets, such as “We need you to hit 40 points per sprint.” This transforms a descriptive metric into a prescriptive goal. When velocity becomes a target, the following behaviors emerge:
- Padding Estimates: Team members may inflate story points to ensure they hit the target.
- Scope Cutting: Teams may split features into smaller chunks to artificially increase the count.
- Quality Sacrifice: The focus shifts from delivering value to hitting the number, potentially bypassing testing or documentation.
3. Predicting Dates for Stakeholders
Using velocity to promise a specific release date to a client based on a single Sprint’s performance is risky. Velocity fluctuates. A team might have a slow sprint due to holidays, sick leave, or unforeseen technical blockers. Using a single data point to commit to a date creates unrealistic expectations.
4. Measuring Individual Performance
Velocity is a team metric. Breaking it down to individual performance is a violation of Scrum principles. Agile relies on cross-functional collaboration. If a developer completes 5 points and another completes 8, comparing them ignores the complexity of the tasks and the dependencies between them.
✅ Proper Application of Velocity
When used correctly, velocity serves the team’s self-management. It is a mirror, not a hammer. Here is how to leverage it effectively.
1. Sprint Planning
The most appropriate use of velocity is in Sprint Planning. By looking at the average velocity of the last three to five Sprints, the team can determine a realistic capacity for the upcoming Sprint.
- Average Calculation: Sum the points of the last 3-5 Sprints and divide by the number of Sprints.
- Commitment: The team pulls work into the Sprint until the total estimated points align with this average.
- Buffer: It is wise to plan slightly below the average to account for interruptions or unexpected work.
2. Release Forecasting
Velocity helps answer the question: “When will the product be ready?” By dividing the total remaining product backlog points by the average velocity, the team can estimate the number of Sprints required to finish the work.
- Range, Not Date: Present forecasts as a range (e.g., “Between Sprint 10 and 12”) rather than a specific calendar date.
- Rolling Updates: Update the forecast regularly as new information emerges or as the backlog changes.
- Transparency: Share the forecast openly with stakeholders so they understand the relationship between scope and time.
3. Identifying Trends
Tracking velocity over time can reveal health indicators within the team or process.
- Consistent Drops: A steady decline might indicate burnout, increasing technical debt, or a change in team composition.
- Consistent Spikes: A sudden increase might indicate that previous estimates were too conservative or that the team found a more efficient workflow.
- Volatility: High variance suggests instability in the process or the Definition of Done.
📉 Velocity vs. Capacity
It is critical to distinguish between velocity and capacity. Confusing these two leads to over-commitment.
- Capacity: Refers to the available time (in hours) a team has to work. This accounts for vacations, meetings, and support duties.
- Velocity: Refers to the amount of work (points) completed. This accounts for the team’s speed and efficiency.
A team might have high capacity (many available hours) but low velocity (struggling with complexity). Conversely, a team might have low capacity (many meetings) but high velocity (high efficiency). Planning requires balancing both.
| Metric | Unit of Measure | Primary Purpose | Who Should Use It |
|---|---|---|---|
| Velocity | Story Points | Forecasting & Planning | The Scrum Team |
| Capacity | Hours | Scheduling Availability | The Scrum Team & Scrum Master |
| Burn Down | Hours/Points | Tracking Progress | Stakeholders & Team |
🧠 The Psychology of Metrics
Metrics influence behavior. This is a fundamental principle of organizational psychology. If you measure X, people will optimize for X. When velocity is the primary measure of success, the team optimizes for velocity, not value.
Psychological Safety
For velocity to be accurate, the team must feel safe admitting when work is blocked or when estimates were wrong. If a team fears that a low velocity will result in punishment, they will:
- Underestimate risks.
- Hide impediments.
- Avoid taking complex tasks.
This leads to the illusion of progress. High velocity numbers in a culture of fear are often a sign of dysfunction, not efficiency.
Continuous Improvement
Velocity should be discussed in the Retrospective, but not as a KPI. Instead, discuss the process that led to the velocity.
- Why was this sprint slower than usual?
- Did we have too many interruptions?
- Was the Definition of Done too strict or too loose?
By focusing on the process, the team improves the underlying system, which naturally stabilizes the velocity over time.
🔄 Handling Variations and Anomalies
Not all Sprints are created equal. Variations in velocity are normal and often expected. Understanding why these variations occur is key to interpreting the data correctly.
1. Team Changes
If a developer leaves or a new member joins, the velocity will likely change. A new member has a learning curve. They may take longer to complete tasks, or they might contribute in unexpected ways. Do not expect immediate parity with previous numbers.
2. Scope Creep
If stakeholders add work mid-Sprint, velocity may drop because the team has less time for the committed items. Alternatively, if the team successfully absorbs the change, velocity might remain stable, but this risks burnout. It is better to reject scope changes or move them to the backlog.
3. Technical Debt
As technical debt accumulates, velocity often decreases because more effort is required to make changes. This is a signal to dedicate Sprints to refactoring. Ignoring this leads to a slow decline in performance.
📊 Summary: Do’s and Don’ts
To ensure velocity remains a helpful tool, adhere to the following guidelines.
| Do ✅ | Don’t ❌ |
|---|---|
| Use it for internal planning only. | Use it to compare teams. |
| Calculate it based on completed work. | Count partially completed work. |
| Discuss trends in Retrospectives. | Set it as a performance target. |
| Focus on relative estimation. | Focus on hours or individual output. |
| Accept variance as normal. | Punish drops in velocity. |
| Update the backlog regularly. | Lock the scope for long periods. |
🚀 Final Considerations for Sustainable Growth
Velocity is a byproduct of a healthy system. If the system is healthy, the velocity will stabilize. If the system is broken, the velocity will fluctuate wildly or decline. The goal is not to maximize velocity; the goal is to maximize value delivery.
When leadership understands that velocity is a planning constraint rather than a productivity engine, the dynamic shifts. Teams feel empowered to set their own pace based on evidence. Stakeholders learn to manage expectations based on ranges rather than promises. The focus returns to delivering quality software that solves user problems.
Remember that metrics are tools for inspection and adaptation. They are not ends in themselves. Keep the team at the center of the conversation. Let the data inform decisions, but let human judgment guide the strategy.
🔍 Frequently Asked Questions
Can velocity increase indefinitely?
No. There are physical and cognitive limits to how much work a team can absorb. As complexity increases, velocity often plateaus or decreases. Continuous growth in velocity usually indicates that estimation standards are slipping, not that productivity is rising.
What if we don’t use Story Points?
Velocity can be calculated using other units, such as hours or ideal days, though Story Points are preferred for their abstraction from time. Regardless of the unit, the principle remains the same: measure completed work relative to past performance.
Does velocity account for bugs?
Only if fixing the bug meets the Definition of Done. If a bug fix is a new task added to the backlog, its points count towards velocity once completed. If it is a defect in work that was already delivered, it is often handled as a separate incident.
How many Sprints should we average?
A minimum of three Sprints provides a baseline. Five to ten Sprints offer a more stable trend line. Use the most recent data as it reflects the current team state and context.
By respecting the nuances of velocity, teams can avoid the traps of metric-driven management. The metric serves the team, not the other way around. This alignment creates an environment where predictability and quality can flourish together.

