Designing software architecture requires more than just writing code. It demands a clear blueprint. A Unified Modeling Language (UML) Class Diagram provides that structure. It visualizes the static structure of a system by showing its classes, attributes, operations, and relationships between objects. This guide walks you through the mechanics of constructing these diagrams effectively.
📊 Why Use UML Class Diagrams?
Before drawing lines and boxes, understanding the purpose is essential. A class diagram serves as a contract between developers and stakeholders. It clarifies how different parts of a system interact without revealing implementation details. Here are the core benefits:
- Visual Communication: Complex logic becomes easier to grasp visually.
- Documentation: Acts as a reference for future maintenance and onboarding.
- Design Validation: Helps identify structural flaws before coding begins.
- Standardization: Uses a universal notation understood globally.
Whether you are building a simple web application or a distributed enterprise system, this diagram type anchors your object-oriented design strategy.
🏗️ Key Components of a Class
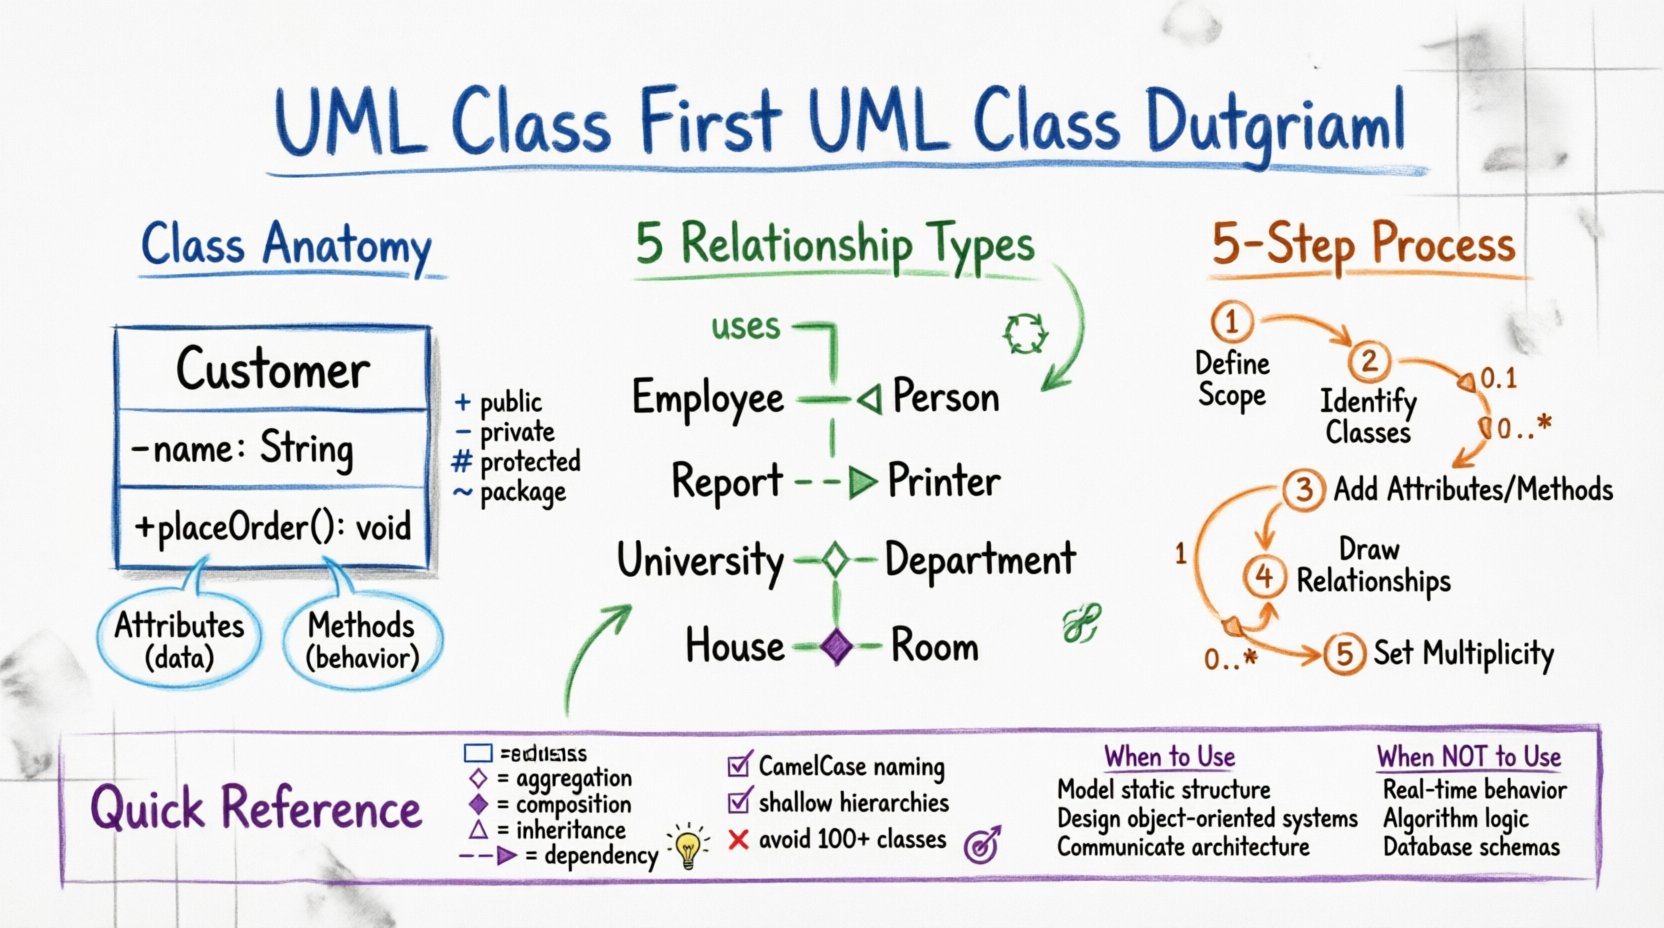
Every class diagram is built from specific building blocks. A class represents a blueprint for objects. In a diagram, it is typically represented as a rectangle divided into compartments.
1. The Class Name
The top compartment holds the name of the class. This should be a noun, capitalized (e.g., Customer or Invoice). If the class is abstract, the name is often italicized.
2. Attributes
The middle compartment lists the properties or data fields associated with the class. These define the state. Each attribute usually follows a specific format:
- Visibility: A symbol indicating access level.
- Name: The identifier for the data.
- Type: The data type (e.g.,
String,Integer). - Default Value: (Optional) A preset value.
Visibility symbols are critical for understanding encapsulation:
+Public: Accessible from anywhere.-Private: Accessible only within the class.#Protected: Accessible within the class and subclasses.~Package: Accessible within the same package.
3. Methods
The bottom compartment contains operations or methods. These define the behavior. Like attributes, they require visibility indicators.
+calculateTotal(): Double-validateInput(): Boolean
When creating your first diagram, ensure you distinguish clearly between what an object knows (attributes) and what an object does (methods).
🔗 Understanding Relationships
Classes rarely exist in isolation. They relate to one another to form a functional system. UML defines specific types of relationships, each with distinct semantics. Misinterpreting these can lead to architectural debt.
Association
An association represents a structural relationship where objects are connected. It implies that one class knows about another. This is the most common relationship.
- Direction: Can be unidirectional or bidirectional.
- Label: Can include a name describing the relationship (e.g.,
owns,uses).
Inheritance (Generalization)
Inheritance allows a class to inherit attributes and methods from another. The child class is a specialized version of the parent. This promotes code reuse.
- Symbol: A solid line with a hollow triangle arrow pointing to the parent class.
- Example:
Employeeinherits fromPerson.
Dependency
A dependency indicates that one class uses or depends on another, but does not store it. Changes in the supplier class may affect the client class.
- Symbol: A dashed line with an open arrow.
- Context: Often used for method parameters or local variables.
Aggregation
Aggregation is a specialized form of association representing a whole-part relationship. The parts can exist independently of the whole.
- Symbol: A solid line with a hollow diamond on the whole side.
- Example: A
UniversityhasDepartments. If the university closes, the department records might still exist.
Composition
Composition is a stronger form of aggregation. The parts cannot exist without the whole. If the whole is destroyed, the parts are destroyed with it.
- Symbol: A solid line with a filled diamond on the whole side.
- Example: A
HousecontainsRooms. If the house is demolished, the rooms cease to exist.
Comparison Table of Relationships
| Relationship | Symbol | Lifecycle | Example |
|---|---|---|---|
| Association | Line | Independent | Student enrolls in Course |
| Inheritance | Hollow Triangle | Specialization | Car extends Vehicle |
| Dependency | Dashed Line + Arrow | Temporary Use | ReportGenerator uses Printer |
| Aggregation | Hollow Diamond | Shared Ownership | Library owns Books |
| Composition | Filled Diamond | Strict Ownership | Order contains LineItems |
🚀 Step-by-Step Construction Process
Now that you understand the symbols, let’s move to the practical application. Follow this workflow to build a robust diagram.
Step 1: Define the Scope
Start by identifying the boundaries of the system. What functionality are you modeling? Is it the entire application or a specific module? Defining the scope prevents the diagram from becoming cluttered and unmanageable.
- List the primary actors or users.
- Identify the core business entities involved.
- Determine the specific features to be modeled.
Step 2: Identify the Classes
Scan your scope description for nouns. These nouns often translate directly into class names. Be careful not to confuse entities with actions or abstract concepts.
- Noun: Order ➡️ Class:
Order - Noun: Customer ➡️ Class:
Customer - Noun: Payment ➡️ Class:
Payment
Avoid creating classes for transient data or simple values. Instead, use primitive types like String or Integer for those attributes.
Step 3: Define Attributes and Methods
For each identified class, populate the compartments. Ask what data each class needs to hold and what actions it must perform.
- Question: What data identifies this object?
- Question: How does this object interact with others?
- Question: What constraints apply to this data?
Keep methods focused. If a method performs too many tasks, consider splitting it into smaller classes or methods.
Step 4: Establish Relationships
Draw lines connecting the classes. Determine the correct relationship type based on the semantic meaning of the connection.
- Does one class own the other? (Use Composition or Aggregation).
- Is one a type of another? (Use Inheritance).
- Do they just know about each other? (Use Association).
Label your lines clearly. A line without a label is often ambiguous. Use verbs to describe associations (e.g., places, reviews).
Step 5: Add Cardinality and Multiplicity
Cardinality defines how many instances of one class relate to instances of another. This is crucial for database design and logic implementation.
- 1: Exactly one.
- 0..1: Zero or one.
- 1..*: One or more.
- 0..*: Zero or more.
- 3: Exactly three.
Place these values near the ends of the association lines. For example, a Customer can place 0..* Orders, but an Order belongs to exactly 1 Customer.
📏 Cardinality and Multiplicity Deep Dive
Understanding multiplicity ensures your model reflects real-world constraints. Here are common scenarios:
- One-to-One: A
Personhas exactly onePassport. - One-to-Many: A
Managermanages0..*Employees. - Many-to-Many: A
Studenttakes0..*Courses, and aCoursehas0..*Students. This usually implies an associative class in the implementation.
When drawing these lines, place the multiplicity closest to the class it describes. If the line is bidirectional, specify multiplicity on both ends.
✨ Best Practices for Clean Diagrams
A complex diagram is hard to maintain. Adhering to these standards will keep your work professional and readable.
1. Naming Conventions
- Use CamelCase for class names (e.g.,
OrderItem). - Use lowerCamelCase for attributes and methods (e.g.,
orderDate,calculateTotal). - Avoid abbreviations unless they are industry standard.
2. Hierarchy Management
Keep inheritance trees shallow. If you find yourself nesting classes deeper than three levels, reconsider your design. Deep hierarchies increase coupling and complexity.
3. Grouping with Packages
If your diagram becomes large, group related classes into packages. This creates a modular view of the system. Use stereotypes like «Package» to denote these groups.
4. Consistency in Notation
Ensure all arrows, diamonds, and lines are uniform. Do not mix styles. Consistency reduces cognitive load for anyone reading the diagram.
5. Avoid Over-Modeling
Not every detail needs to be in the class diagram. Focus on the structural relationships. Detailed logic flow belongs in sequence or activity diagrams. Keep the class diagram focused on static structure.
⚠️ Common Pitfalls to Avoid
Even experienced designers make mistakes. Watch out for these common errors.
- Ignoring Visibility: Forgetting to mark attributes as private or public can lead to security vulnerabilities in the implementation.
- Mixing Aggregation and Composition: Using composition when the lifecycle is independent leads to data loss risks. Use aggregation if the child can exist without the parent.
- Too Many Classes: A diagram with 100+ classes is often useless. Split the system into subsystems.
- Missing Multiplicity: Leaving relationships without cardinality creates ambiguity for developers implementing the logic.
- Circular Dependencies: Avoid classes that depend on each other directly. This creates tight coupling that is hard to refactor.
🤔 When to Use Class Diagrams
Class diagrams are not the solution for every problem. Use them when:
- Designing the object-oriented structure of an application.
- Documenting the data model for a database.
- Communicating the static structure to a development team.
- Planning the refactoring of legacy code.
Do not use them for:
- Modeling dynamic behavior (use Sequence or State diagrams).
- Describing user workflows (use Activity or Use Case diagrams).
- Defining network topology (use Deployment diagrams).
📝 Summary of Symbols
Keep this cheat sheet handy while you work.
| Element | Representation | Meaning |
|---|---|---|
| Class | Rectangle | A blueprint for objects |
| Public Attribute | + name: type | Accessible globally |
| Private Attribute | – name: type | Accessible internally |
| Method | + methodName(params): return | Behavior of the class |
| Association | Line | Connection between classes |
| Generalization | Hollow Triangle | Inheritance (Is-A) |
| Composition | Filled Diamond | Strong Ownership (Part-Of) |
| Aggregation | Hollow Diamond | Weak Ownership (Part-Of) |
| Dependency | Dashed Arrow | Usage Relationship |
🎨 Finalizing Your Design
Once you have drawn the classes and relationships, review the diagram. Walk through a scenario mentally. If a Customer places an Order, does the diagram support that flow? Are the attributes sufficient to store the necessary data? Are the methods clear?
Iterate. The first version is rarely perfect. Refine the naming, adjust the multiplicity, and clarify the relationships. A well-crafted class diagram is a living document that evolves with your codebase.
📚 Next Steps
After mastering the class diagram, explore how these classes interact over time. Look into Sequence Diagrams to visualize message passing. Combine your static structure with dynamic behavior to create a complete system specification.
Start small. Model a simple module first. Apply these principles consistently. As you gain experience, the complexity you can handle will grow naturally. This foundation is critical for any serious software engineering career.

