


Architecting software systems is akin to designing a city. You need roads, buildings, and power grids to function together. For students entering the world of software engineering, the transition from monolithic thinking to distributed systems can feel overwhelming. This is where component diagrams become essential. They provide a visual language to describe the internal structure of systems without getting bogged down in code syntax. When paired with microservices architecture, these diagrams offer a blueprint for understanding how independent services interact.
This guide aims to demystify the relationship between component diagrams and microservices. We will explore how to visualize service boundaries, define interfaces, and manage complexity. Whether you are designing a small application or planning a large-scale enterprise system, mastering this visual representation is crucial for clear communication and robust design.
Understanding Component Diagrams 📐
A component diagram is a specific type of Unified Modeling Language (UML) diagram. It describes the physical organization of software. Unlike class diagrams that focus on data structures, component diagrams focus on modules, libraries, and executable units. Think of a component as a box that encapsulates functionality. It hides the internal complexity behind a set of interfaces.
For students, understanding the anatomy of a component diagram is the first step. Here are the core elements you will encounter:
- Component: A modular part of a system. It represents a deployable unit.
- Interface: A contract that defines how other parts interact with the component. It specifies operations but hides implementation details.
- Port: A specific point of interaction where an interface is exposed.
- Connector: The line or arrow showing communication paths between components.
- Dependency: A relationship indicating that one component relies on another to function correctly.
Visualizing these elements helps in breaking down a system. Instead of looking at a massive block of code, you see distinct blocks that can be developed, tested, and deployed independently. This modularity is the foundation of modern architecture.
The Microservices Landscape 🏗️
Microservices architecture is a design pattern where an application is built as a collection of small, independent services. Each service runs in its own process and communicates with others via lightweight mechanisms, often HTTP or message queues. This contrasts with the monolithic approach, where all functionality exists within a single codebase.
Why do students need to understand microservices? Because this pattern dominates modern cloud-native development. It offers scalability and resilience. However, it introduces complexity. Managing dozens of services requires clear boundaries. This is where diagrams become vital.
Key characteristics of microservices include:
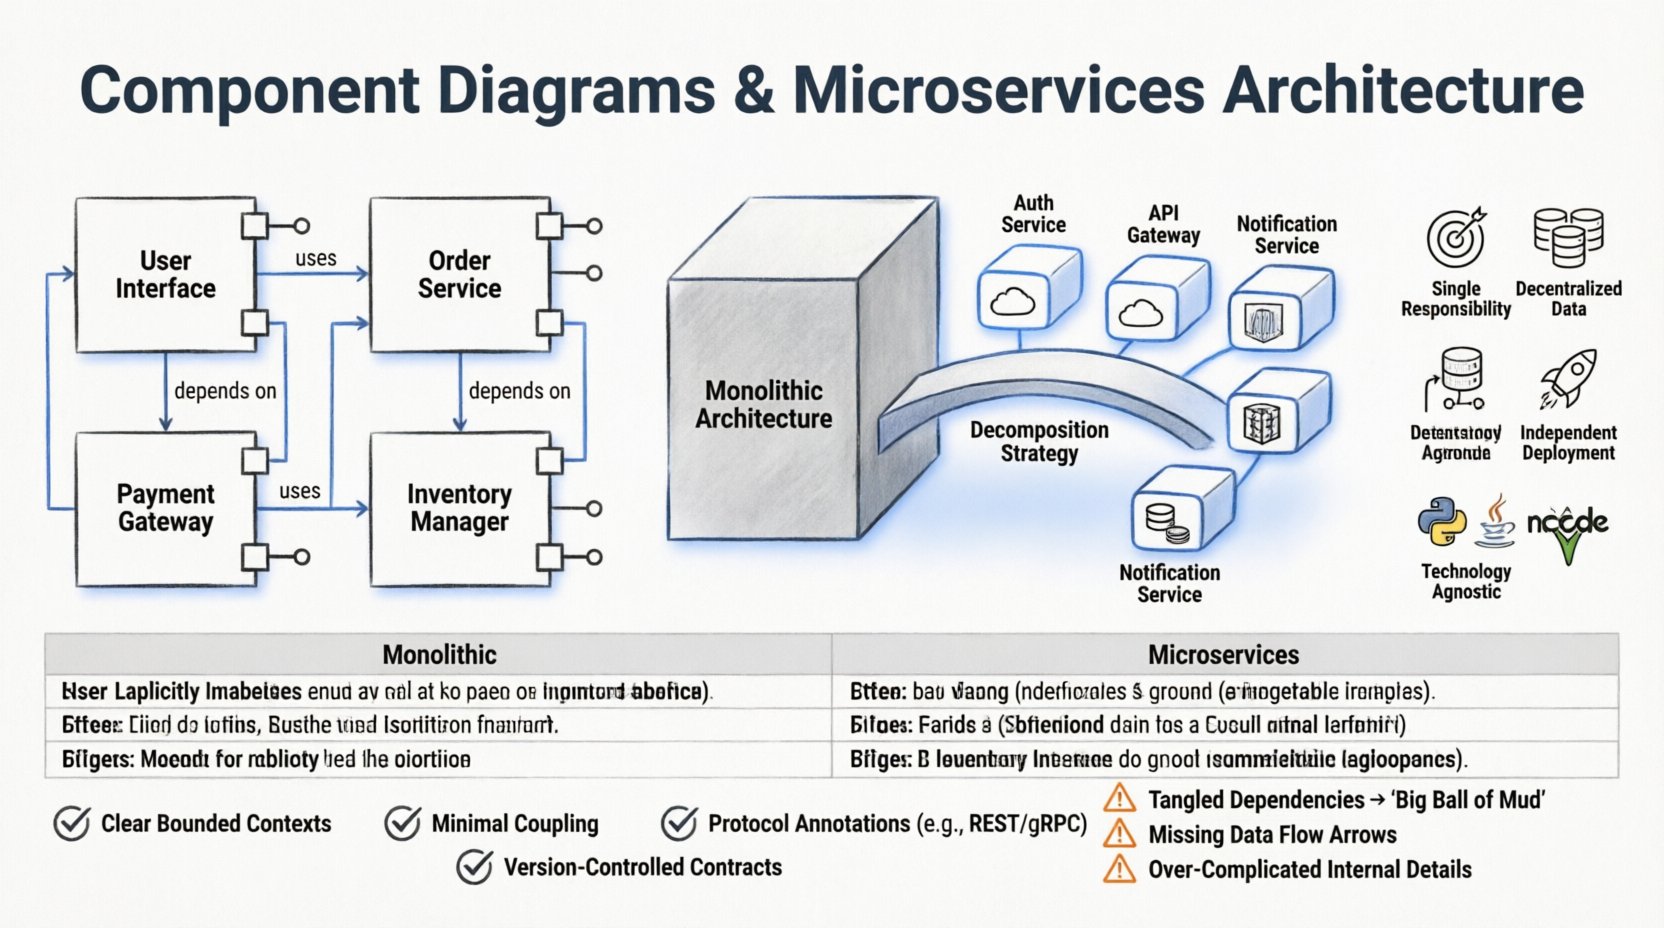
- Single Responsibility: Each service handles one business capability.
- Decentralized Data: Services manage their own data stores.
- Independent Deployment: You can update one service without taking down the whole system.
- Technology Agnostic: Different services can use different languages or databases.
Without a clear map, these services can become a tangled web. A component diagram provides the structure needed to maintain order.
Bridging the Gap: Mapping Components to Services 🔗
The core challenge for students is translating the abstract concept of a microservice into a concrete component diagram. While not always a one-to-one mapping, the relationship is strong. A microservice often corresponds to a component or a cluster of components within a larger system.
Here is how you approach this mapping process:
- Identify Boundaries: Determine where one service ends and another begins. This usually aligns with business domains.
- Define Interfaces: What data does this service need to exchange? Define the API contracts clearly.
- Map Dependencies: If Service A calls Service B, draw a dependency arrow. This highlights coupling.
- Group Functionality: Group related operations into a single component box to reduce visual noise.
Consider the following comparison to understand how components relate to services:
| Aspect | Component (UML) | Microservice (Architecture) |
|---|---|---|
| Scope | Logical module within an application | Deployable unit, often in a container |
| Communication | Method calls or interface usage | Network requests (REST, gRPC, Messages) |
| Deployment | Part of a larger executable | Independent runtime environment |
| Data | Shared or private storage | Typically private to the service |
Understanding these nuances helps in drawing accurate diagrams. A component diagram for microservices should reflect the deployment topology. It is not just about logic; it is about infrastructure.
Designing for Clarity and Maintenance 📝
Creating a diagram is one thing; keeping it useful is another. Students often make the mistake of creating diagrams that are too detailed or too abstract. A good diagram strikes a balance. It should answer the questions developers need to answer without overwhelming them with implementation specifics.
To ensure your diagrams remain valuable, follow these guidelines:
- Use Abstraction Levels: Start with a high-level view showing major services. Then drill down into specific components within a service.
- Label Interfaces Clearly: Name your ports and interfaces descriptively. Avoid generic names like “Input” or “Output”.
- Minimize Cross-Service Coupling: If your diagram shows every service talking to every other service, you have a design problem. Aim for a mesh with clear paths.
- Include Protocols: Indicate the communication method. Is it synchronous HTTP? Is it asynchronous messaging?
- Versioning: If interfaces change, update the diagram. An outdated diagram is worse than no diagram.
Common Pitfalls in Visualization 🚫
Even experienced architects make mistakes. Students often fall into traps that make their designs harder to implement. Being aware of these common errors can save time during the coding phase.
1. The “Big Ball of Mud”
When dependencies are drawn without direction, the system looks chaotic. Every component connects to every other component. This indicates tight coupling. In a microservices context, this leads to the “distributed monolith” problem, where changes in one service break others unexpectedly.
2. Ignoring Data Flow
Component diagrams often focus on logic but ignore data. In microservices, data consistency is a major challenge. Ensure your diagrams show where data is stored and how it moves between services. Use stereotypes or notes to indicate database access.
3. Over-Complicating the View
Trying to show every internal class or method within a component box defeats the purpose. Components should be black boxes. Show what they do, not how they do it. Keep the internal details for class diagrams or code.
4. Static Representation of Dynamic Systems
Microservices are dynamic. They scale up and down. A static diagram cannot show runtime behavior. Supplement your component diagram with sequence diagrams for specific workflows. Use the component diagram for structure and the sequence diagram for behavior.
Strategies for Student Success 🎓
Learning to visualize architecture takes practice. Here are practical steps to improve your skills and understanding of component diagrams in a microservices environment.
- Start with Paper: Before using any software, sketch your ideas on paper. This encourages thinking about structure rather than aesthetics.
- Iterate Frequently: Draw the diagram, build a prototype, update the diagram. Repeat. The diagram should evolve with the code.
- Collaborate: Draw diagrams with peers. Discussing the boundaries and interfaces helps reveal logic gaps you might have missed.
- Focus on Contracts: Spend time defining the interface contracts. If the interface is solid, the internal component implementation can change without breaking the system.
- Study Existing Systems: Look at open-source architecture diagrams. Analyze how large projects structure their components and services.
Tools and Platforms 🛠️
While you should focus on concepts first, using the right tools can streamline the process. There are many platforms available for creating diagrams. They range from simple drawing tools to complex modeling environments.
When selecting a tool, consider the following:
- Export Capabilities: Can you export to PDF or image formats for documentation?
- Collaboration: Can multiple people edit the diagram simultaneously?
- Standard Compliance: Does it support UML standards?
- Integration: Can it integrate with your version control system?
Remember, the tool does not make the design. A beautiful diagram drawn on a fancy platform is still useless if the architecture is flawed. Focus on the content of the diagram, not the elegance of the tool.
Advanced Considerations for Distributed Systems 🔍
As you progress in your studies, you will encounter more complex scenarios. Microservices often operate in cloud environments. This adds layers of networking, security, and scaling to your diagrams.
1. Security Boundaries
Services communicate over networks. This means traffic is not always secure by default. Indicate security layers in your diagrams. Use annotations to show where authentication or encryption happens. This is crucial for understanding how data is protected.
2. Service Discovery
In dynamic environments, service addresses change. Your diagram should acknowledge how services find each other. You might add a note about a service registry or load balancer that sits between components.
3. Resilience Patterns
Networks fail. Components fail. Your diagram can hint at resilience. For example, you might show a fallback component or a circuit breaker pattern connecting two services. This shows you understand that failure is part of the system design.
Conclusion on Visualization 🏁
Component diagrams are more than just drawings. They are communication tools. They allow teams to agree on how a system is built before writing a single line of code. For students, they are a bridge between theoretical computer science and practical engineering.
By understanding the mapping between components and microservices, you gain the ability to design systems that are scalable, maintainable, and robust. Focus on clear boundaries, well-defined interfaces, and honest documentation. Avoid the temptation to over-simplify or over-complicate. Keep the diagram aligned with the actual code.
As you move forward in your career, remember that architecture is a continuous process. Diagrams are living documents. They should be updated as the system evolves. This practice ensures that knowledge is preserved and shared effectively across the team. With the right approach to visualization, you will navigate the complexities of modern software architecture with confidence.
Take your time. Draw often. Think about the connections. The gap between code and design is bridged by these diagrams. Mastering them will make you a stronger engineer.

