


Software architecture relies on clear communication. A component diagram is one of the most effective ways to convey how a system is built. While modern software exists, sometimes the most effective tool is your hands, a pen, and a whiteboard. This guide explores how to construct detailed component diagrams manually or with basic resources, focusing on clarity and structure rather than software features.
Understanding the Component Diagram 🧩
A component diagram represents the physical and logical building blocks of a system. It shows the organization and dependencies between different parts. Unlike class diagrams which focus on code structure, component diagrams focus on subsystems, modules, and external libraries. They provide a high-level view of the system architecture.
Why create these diagrams without complex software?
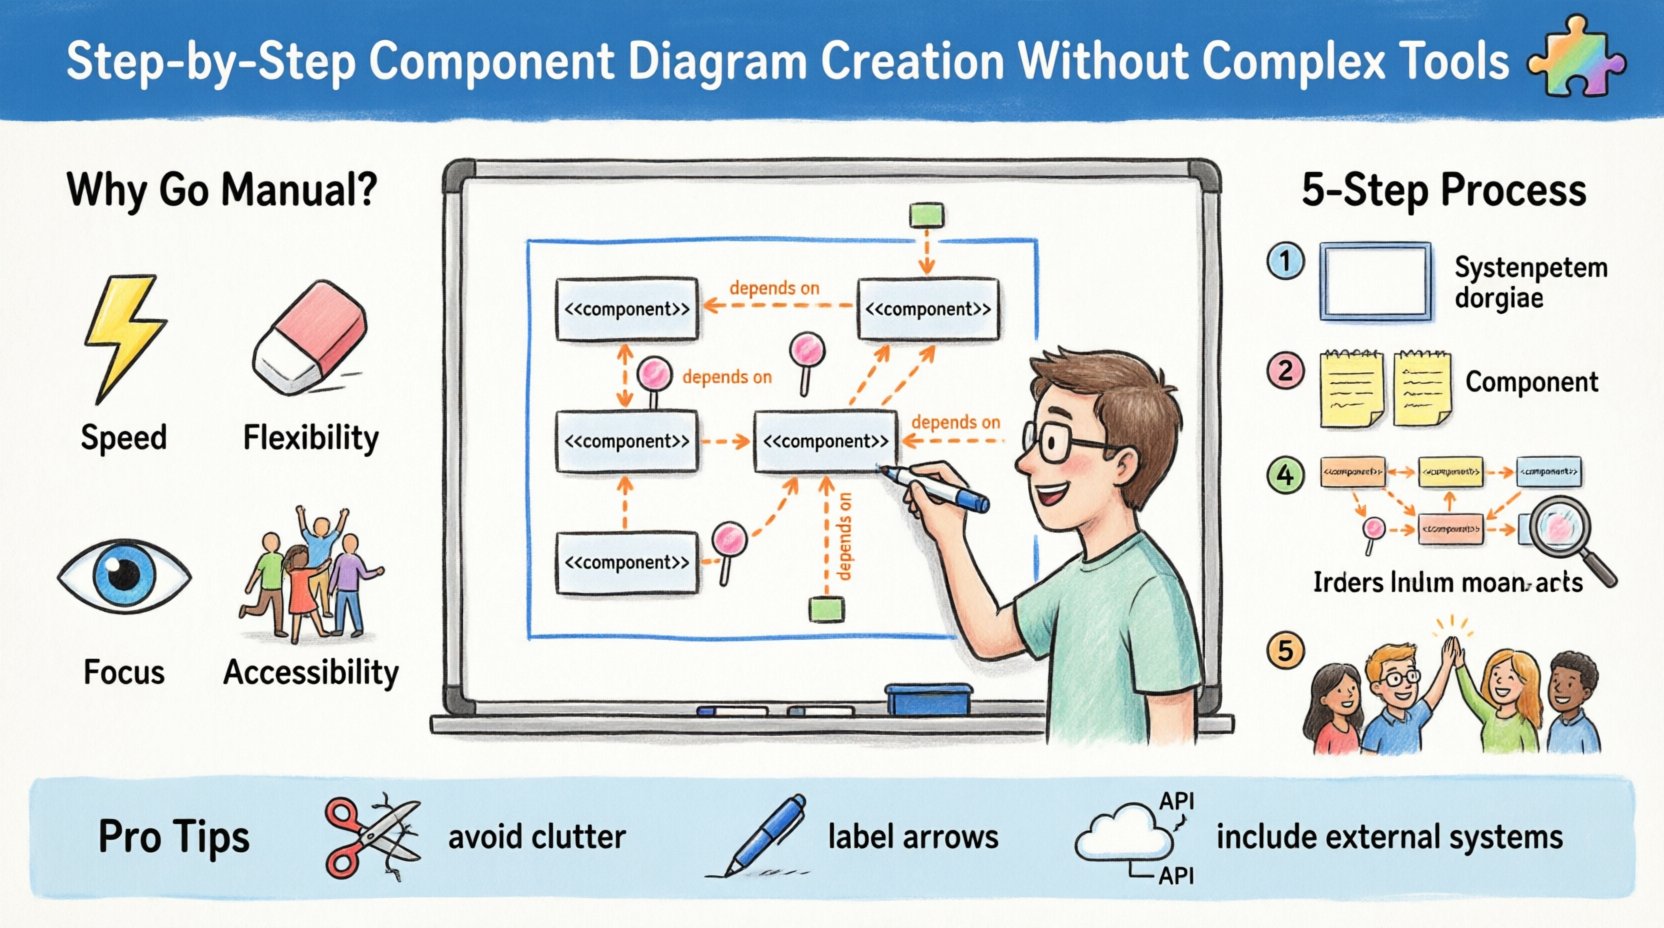
- Speed: Sketching ideas faster than navigating menus.
- Flexibility: Easy to erase and redraw without losing layers.
- Focus: Removes distractions from formatting and tooling.
- Accessibility: Anyone with a pen and paper can participate.
The goal is to communicate relationships. A component is a modular part of a system. It encapsulates implementation details. Interfaces define how components interact.
Core Elements You Need to Know 🔍
Before drawing, you must understand the symbols and concepts. These are standard notations used in Unified Modeling Language (UML) for component diagrams.
1. Components
These are the main units of the system. They can be:
- Software modules
- Libraries
- Databases
- External systems
- Microservices
Visually, they are often represented as rectangles with a specific icon or label. The stereotype <<component>> is often placed at the top.
2. Interfaces
An interface is a contract that defines operations a component provides or requires. It has no implementation. In diagrams, interfaces are shown as circles (lollipop notation) or rectangles with a label.
- Provided Interface: A component offers functionality.
- Required Interface: A component needs functionality to operate.
3. Ports
Ports are interaction points on a component. They define where connections are made. A component can have multiple ports, each connected to specific interfaces.
4. Dependencies
Dependencies show usage relationships. One component relies on another. This is typically a dashed arrow pointing from the client to the supplier.
5. Realization
This relationship shows that a component implements an interface. It is a dashed arrow with a hollow triangle pointing to the interface.
Preparation Before You Draw 📝
Jumping straight to drawing often leads to messy diagrams. Preparation ensures the final output is accurate and useful.
Gather Requirements
Collect information about the system. What are the main functions? What are the external systems involved? List the high-level goals.
Identify Boundaries
Define what is inside the system and what is outside. This helps determine which components are internal and which are external dependencies.
Select Your Medium
Depending on your environment, choose the right physical medium:
- Whiteboard: Best for team collaboration and quick iteration.
- Large Paper: Good for individual deep work and archiving.
- Sticky Notes: Excellent for movable components during planning.
The Manual Drafting Process ✍️
Follow these steps to create a structured diagram using basic tools.
Step 1: Define the Scope
Draw a box to represent the system boundary. Label it clearly. This defines the context for all other elements. Everything outside this box is external.
Step 2: Place Major Components
Identify the largest subsystems. Place them inside the boundary. Use sticky notes if possible, as you may need to move them. Ensure they are large enough to contain internal details if needed.
Step 3: Add Interfaces
Draw circles or ports on the components. Label them with the services they offer. For example, a "Payment Service" might have a provided interface called "ProcessTransaction".
Step 4: Connect Dependencies
Draw lines between components. Use arrows to indicate direction. A component that uses another should have an arrow pointing toward the supplier. Label the arrow if the relationship is specific.
Step 5: Review for Clarity
Step back and look at the diagram. Are there crossing lines? Is the flow logical? Redraw sections if necessary. Clean lines improve readability.
Defining Relationships and Dependencies 🔗
Understanding how components interact is critical. The following table outlines common relationships and how to represent them manually.
| Relationship | Meaning | Visual Representation |
|---|---|---|
| Dependency | One component uses another | Dashed arrow pointing to used component |
| Association | Structural link between instances | Solid line |
| Realization | Interface implementation | Dashed arrow with hollow triangle |
| Usage | Client uses Supplier service | Dashed arrow with <<uses>> label |
When drawing these manually, consistency is key. Use the same line thickness for all dependencies. Use the same arrowhead style for all realization links. This visual consistency reduces cognitive load for anyone reading the diagram.
Refinement and Naming Conventions 🏷️
A diagram is useless if the labels are confusing. Naming conventions ensure that every stakeholder understands the diagram.
Component Naming
- Use nouns that describe function (e.g., "OrderProcessor", not "Module1").
- Keep names consistent across the document.
- Avoid abbreviations unless they are standard in your industry.
Interface Naming
- Use verbs for actions (e.g., "GetUser", "SaveData").
- Include versioning if the interface changes frequently.
- Mark required vs. provided clearly.
Port Naming
- Group ports by function.
- Label the direction of data flow if relevant.
Collaborative Review Without Software 🤝
One of the benefits of manual diagramming is the ability to collaborate in real-time. You do not need cloud access or account logins to review a diagram.
Physical Walkthroughs
Gather the team around a whiteboard. Walk through the diagram together. Ask specific questions:
- Does this dependency make sense?
- Is there a circular dependency here?
- Are all required interfaces provided?
Digital Capture
Once the manual diagram is finalized, capture it for records. You do not need expensive scanning software. A smartphone camera is sufficient.
- Lighting: Ensure even lighting to avoid shadows.
- Angle: Take the photo from directly above.
- Resolution: Use high resolution for readability.
Sharing the Image
Send the image through standard communication channels. Email, messaging apps, or document repositories work fine. The image serves as a snapshot of the architectural state at that time.
Common Mistakes to Avoid ⚠️
Even with simple tools, errors occur. Awareness of common pitfalls helps maintain diagram quality.
Overcomplication
Do not try to show every single detail. A component diagram is high-level. If you need to show code logic, use a class diagram or sequence diagram instead. Keep the component view focused on modules.
Ignoring External Systems
Systems do not exist in a vacuum. Do not forget to include databases, third-party APIs, or user interfaces as components. They often act as suppliers or clients.
Inconsistent Notation
Switching between different symbols for the same concept confuses readers. Stick to standard UML notation for components and interfaces.
Missing Labels
Arrows without labels imply a generic dependency. Labeling the dependency (e.g., "Read Access", "Write Access") adds necessary context.
When to Switch to Digital Tools 💻
Manual methods are excellent for planning and initial design. However, there are times when digital tools become necessary. This decision is based on scale and maintenance needs.
| Scenario | Manual Method | Digital Method |
|---|---|---|
| Small Project | ✅ Ideal | Optional |
| Large System | ❌ Hard to manage | ✅ Necessary |
| Frequent Changes | ❌ Time consuming to redraw | ✅ Easy to edit |
| Version Control | ❌ Difficult | ✅ Supported |
| Team Collaboration | ✅ Good for in-person | ✅ Good for remote |
Even if you switch to digital tools later, the logic established in the manual phase remains valid. The manual phase is about thinking, not drawing.
Maintaining the Diagram 🔄
A diagram is a living document. It must evolve as the system changes. Neglecting updates renders the diagram useless.
Update Triggers
- New features are added.
- Legacy components are removed.
- Dependencies shift.
- Architecture refactoring occurs.
Versioning Strategy
Keep track of revisions. Date your diagrams. Store the previous version alongside the new one. This history helps in auditing changes and understanding why certain decisions were made.
Documentation Links
Link the diagram to other documentation. If a component has detailed API specs, reference them in the diagram notes. This creates a connected knowledge base without requiring a single tool.
Conclusion on Manual Diagramming
Creating component diagrams without complex tools is a disciplined practice. It forces you to focus on the essential relationships and structures. By using paper, whiteboards, and basic digital capture, you can achieve the same clarity as expensive software.
The process emphasizes understanding over aesthetics. It prioritizes the flow of information between modules. This approach is suitable for startups, agile teams, and maintenance phases where speed and clarity are paramount.
Start with the basics. Define your components. Connect them logically. Review with your team. This cycle ensures your architecture documentation remains accurate and useful over time.

