


The foundation of software design has always relied on visualization. Component diagrams have served as the blueprint for developers and architects for decades. However, the landscape of software engineering is undergoing a profound transformation. We are moving away from static, monolithic structures toward dynamic, distributed ecosystems. This shift necessitates a reevaluation of how we model, document, and interact with our system architectures. 🔄
As systems become more complex, the traditional role of a component diagram is expanding. It is no longer just a static drawing used at the beginning of a project. It is evolving into a living representation of system interactions, data flows, and operational boundaries. This article explores the trajectory of component diagrams within modern software architecture, examining how they adapt to new paradigms without losing their fundamental purpose. ⚙️
The Legacy of Component Diagrams 📜
To understand the future, we must acknowledge the past. The Unified Modeling Language (UML) component diagram was designed to model the physical and logical components of a system. In the era of monolithic applications, these diagrams were straightforward. They depicted a clear hierarchy where a server hosted a set of libraries, which in turn contained the business logic. The boundaries were rigid. The deployment topology matched the logical design closely.
- Static Representation: Diagrams were created before coding began and rarely updated during development.
- Logical Focus: Emphasis was placed on internal structure rather than network behavior.
- Manual Maintenance: Updating diagrams required human intervention, often leading to documentation drift.
While these diagrams provided clarity, the rise of agile methodologies and DevOps practices exposed limitations. The speed of delivery required documentation that kept pace with code. Static drawings could not satisfy the demand for real-time visibility. This created a gap between the design intent and the running system. 📉
The Shift to Distributed Systems 🌐
Modern architecture is defined by distribution. Whether it is microservices, serverless functions, or event-driven streams, the components of a system are no longer co-located. They are spread across networks, clouds, and regions. This dispersion changes the nature of a component. A component is no longer just a class library or a module; it is a deployable unit with its own lifecycle.
In this context, the component diagram must account for:
- Network Latency: Communication paths are now explicit requirements, not implicit assumptions.
- Service Boundaries: The interface between services is the most critical part of the design.
- Data Consistency: Distributed transactions require clear modeling of data ownership and synchronization.
Architects are finding that the standard UML notation is insufficient for capturing the nuances of distributed communication. The evolution involves adding layers of abstraction that describe how components interact across the wire, not just how they are structured in memory. This shift is subtle but significant. It moves the diagram from a structural view to a behavioral view. 🏗️
Granularity and Component Definition 🔬
One of the biggest challenges in modern architecture is defining what constitutes a component. In the past, a component might have been a single module. Today, it could be a container, a function, or a cluster of services. This ambiguity requires a more flexible approach to diagramming.
The future of component diagrams lies in adaptable granularity. The diagram should allow zooming in and out without losing context. At a high level, a component represents a business capability. At a lower level, it represents a specific deployment unit. This multi-resolution approach ensures that stakeholders can view the system from their required perspective without needing multiple distinct documents.
- Business Level: Focus on value streams and user-facing capabilities.
- System Level: Focus on services, APIs, and data stores.
- Implementation Level: Focus on containers, instances, and code modules.
By supporting this hierarchy, the diagram becomes a tool for communication across different teams. Developers see the implementation details, while product managers see the functional capabilities. This alignment reduces friction and improves the overall quality of the software. 🤝
Integration with API Specifications 📡
Interfaces are the glue that holds modern architecture together. The component diagram is increasingly merging with API design specifications. OpenAPI and similar standards define the contracts between services. Modern diagramming tools and methods are beginning to integrate these definitions directly into the visual model.
This integration ensures that the diagram is not just a picture, but a functional artifact. When an API changes, the diagram updates. This synchronization prevents the common issue where documentation becomes outdated immediately after deployment. The evolution here is towards model-driven engineering, where the diagram acts as the source of truth.
Key Benefits of API Integration
- Consistency: Interface definitions match the visual representation exactly.
- Validation: Automated checks can verify that the diagram matches the code.
- Discovery: Developers can navigate from the diagram directly to the API documentation.
This approach reduces the cognitive load on engineers. They do not need to mentally map a visual box to a text specification. The two are unified. This unification is critical as systems scale and the number of interfaces grows exponentially. 🔗
Automation and Live Documentation 🤖
Manual maintenance of diagrams is a bottleneck. In high-velocity environments, a diagram that is not updated weekly is useless. The future of component diagrams is automation. Tools are emerging that can parse code repositories and generate diagrams dynamically. This process turns the diagram into a live artifact that reflects the current state of the codebase.
This shift addresses the problem of documentation drift. When code is refactored, the diagram updates. This ensures that new team members can onboard with accurate information. It also aids in impact analysis. When a change is proposed, the diagram can show which other components are affected.
- Continuous Integration: Diagrams are generated as part of the build pipeline.
- Version Control: Diagrams are stored alongside code, allowing for history tracking.
- Feedback Loops: Discrepancies between code and diagram trigger alerts during review.
The goal is to make diagramming a byproduct of development, not a separate task. By embedding visualization into the workflow, teams can maintain high fidelity without sacrificing speed. This is a crucial step in the evolution of architectural modeling. ⚡
Security and Compliance Visualization 🔒
Security is no longer an afterthought. It is a core architectural requirement. Component diagrams are evolving to include security boundaries, trust zones, and data classification. In regulated industries, understanding data flow is mandatory. The diagram must show where sensitive data moves and how it is protected.
Modern diagrams incorporate:
- Trust Zones: Visual indicators for different security levels (e.g., internal vs. external).
- Encryption: Labels indicating where data is encrypted in transit and at rest.
- Access Control: Annotations showing authentication and authorization requirements for each component.
This level of detail helps architects identify vulnerabilities before deployment. It ensures that security teams can review the system design without needing access to the source code. This collaboration between security and architecture is becoming standard practice. 🛡️
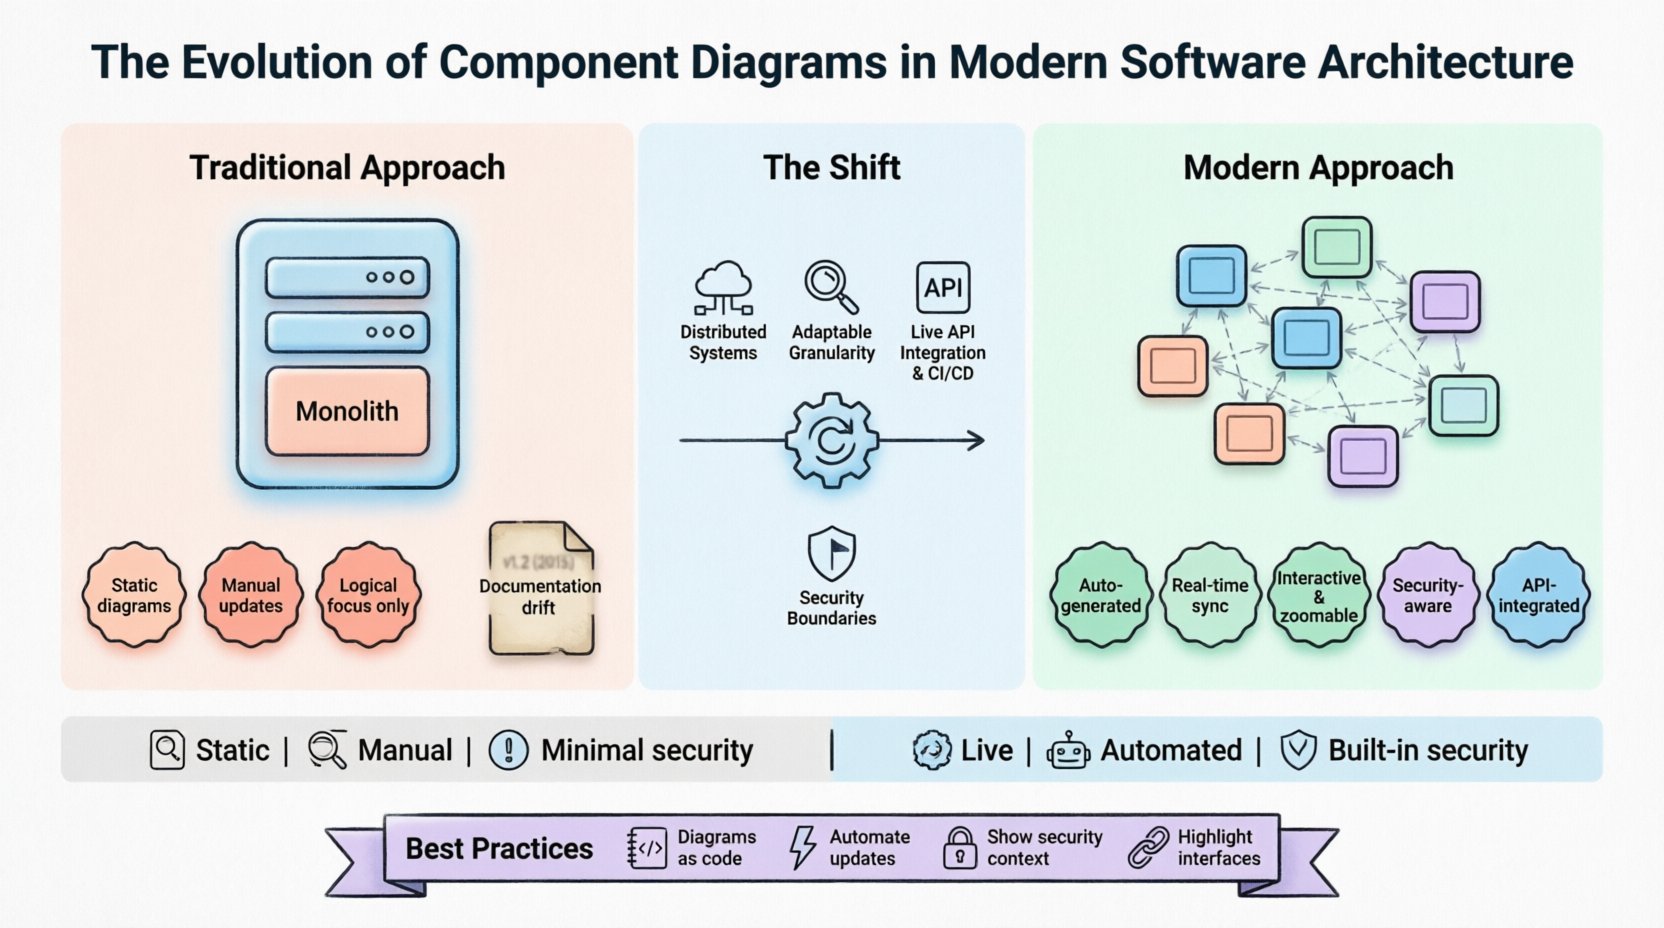
Comparison: Traditional vs. Modern Approaches 📊
To clearly understand the evolution, it is helpful to compare the characteristics of traditional component diagrams with their modern counterparts. The following table outlines the key differences in focus, maintenance, and scope.
| Feature | Traditional Component Diagram | Modern Component Diagram |
|---|---|---|
| Scope | Logical structure within a single system | Distributed system across multiple environments |
| Granularity | Classes, modules, libraries | Services, containers, functions, APIs |
| Maintenance | Manual updates by architects | Automated generation from code or configs |
| Interactivity | Static image or PDF | Interactive, zoomable, and searchable |
| Integration | Isolated from development tools | Integrated with CI/CD and API specs |
| Security | Minimal representation | Explicit trust zones and data flow |
| Updates | Periodic or on major releases | Real-time or near real-time |
This comparison highlights the necessity of adaptation. The traditional model served its time well, but it cannot support the complexity of modern cloud-native applications. The modern approach prioritizes accuracy, automation, and context. 📈
Challenges in Modern Representation 🧩
Despite the benefits, the evolution of component diagrams is not without challenges. One significant issue is visual clutter. As systems grow, diagrams can become dense and unreadable. If a diagram contains too much information, it fails to communicate the architecture effectively.
Another challenge is the standardization of notation. Different tools and teams may use different symbols for the same concept. This fragmentation can lead to confusion when collaborating across organizations. There is a need for more universal standards that can handle both traditional UML and modern cloud-native patterns.
- Visual Complexity: Managing the density of information in large systems.
- Tooling Fragmentation: Lack of interoperability between different modeling platforms.
- Skills Gap: Teams need to learn new tools and methodologies to maintain modern diagrams.
Addressing these challenges requires a balanced approach. Tools must be powerful enough to handle complexity but simple enough to be usable. Standards must be flexible enough to accommodate different architectural styles while maintaining clarity. This balance is the key to successful adoption. ⚖️
Best Practices for Future-Proofing 🛠️
To ensure that your architectural documentation remains relevant, consider these best practices. They focus on maintaining clarity and value throughout the lifecycle of the software.
1. Keep it High Level Where Possible
Do not attempt to diagram every class or method. Focus on the boundaries that matter for decision-making. High-level views help stakeholders understand the system without getting lost in implementation details. Use zooming capabilities to drill down when necessary.
2. Treat Diagrams as Code
Store your diagrams in version control. Treat them with the same rigor as source code. This allows for peer reviews, history tracking, and rollback capabilities. It also ensures that diagrams are reviewed alongside code changes.
3. Automate Where You Can
Use automation to generate diagrams from code or infrastructure configurations. This reduces the maintenance burden and ensures accuracy. Manual updates should be reserved for high-level design decisions, not implementation details.
4. Include Security Context
Always document security boundaries. Show where data is sensitive and how it is protected. This practice makes security reviews easier and helps identify vulnerabilities early in the design phase.
5. Focus on Interfaces
Define and document the interfaces between components clearly. In distributed systems, the contract between services is more important than the internal logic. Ensure that the diagram highlights these connections. 🎯
The Role of AI in Diagramming 🧠
Artificial intelligence is beginning to influence how diagrams are created and maintained. AI can analyze code repositories and suggest architectural improvements. It can detect inconsistencies between the code and the diagram automatically. This technology reduces the manual effort required to keep documentation up to date.
In the future, AI might assist in generating diagrams from natural language requirements. This would lower the barrier to entry for creating architectural documentation. Teams could describe what they want in plain text, and the system would generate the appropriate visual model. This capability would streamline the design process significantly.
- Automated Refactoring: AI suggests better component boundaries based on usage patterns.
- Pattern Recognition: Identifying common architectural anti-patterns in real-time.
- Generative Design: Creating diagrams from textual descriptions of requirements.
While AI will not replace the need for human judgment, it will augment the architect’s capabilities. It allows humans to focus on high-level strategy while machines handle the repetitive tasks of documentation. This partnership is likely to define the next era of software architecture. 🚀
Conclusion 🏁
The evolution of component diagrams is a reflection of the changing nature of software itself. As systems become more distributed, dynamic, and complex, our tools for visualizing them must adapt. The static, manual diagrams of the past are giving way to automated, integrated, and living models. This transition is essential for managing modern software architecture effectively.
By embracing automation, integrating with API specifications, and focusing on security boundaries, architects can create diagrams that provide real value. These diagrams will serve as the bridge between design and implementation, ensuring that the system remains understandable as it grows. The future of component diagrams is not about drawing better pictures; it is about enabling better decisions. 🌟
Staying ahead of this evolution requires a commitment to continuous learning and adaptation. Architects who invest in modern modeling practices will find themselves better equipped to handle the challenges of the future. The component diagram remains a vital tool, but its form and function are shifting to meet the demands of the digital age. 🏗️

