


In the complex world of software architecture, clarity is paramount. When developers and architects communicate the structural design of a system, visual representations bridge the gap between abstract logic and concrete implementation. One of the most powerful tools for this purpose is the component diagram. These diagrams provide a high-level view of the system’s modular structure, allowing teams to understand how different parts interact without getting lost in the code details. This guide explores the fundamentals, notation, and practical applications of component modeling to help you build robust, maintainable systems.
What is a Component Diagram? 🧩
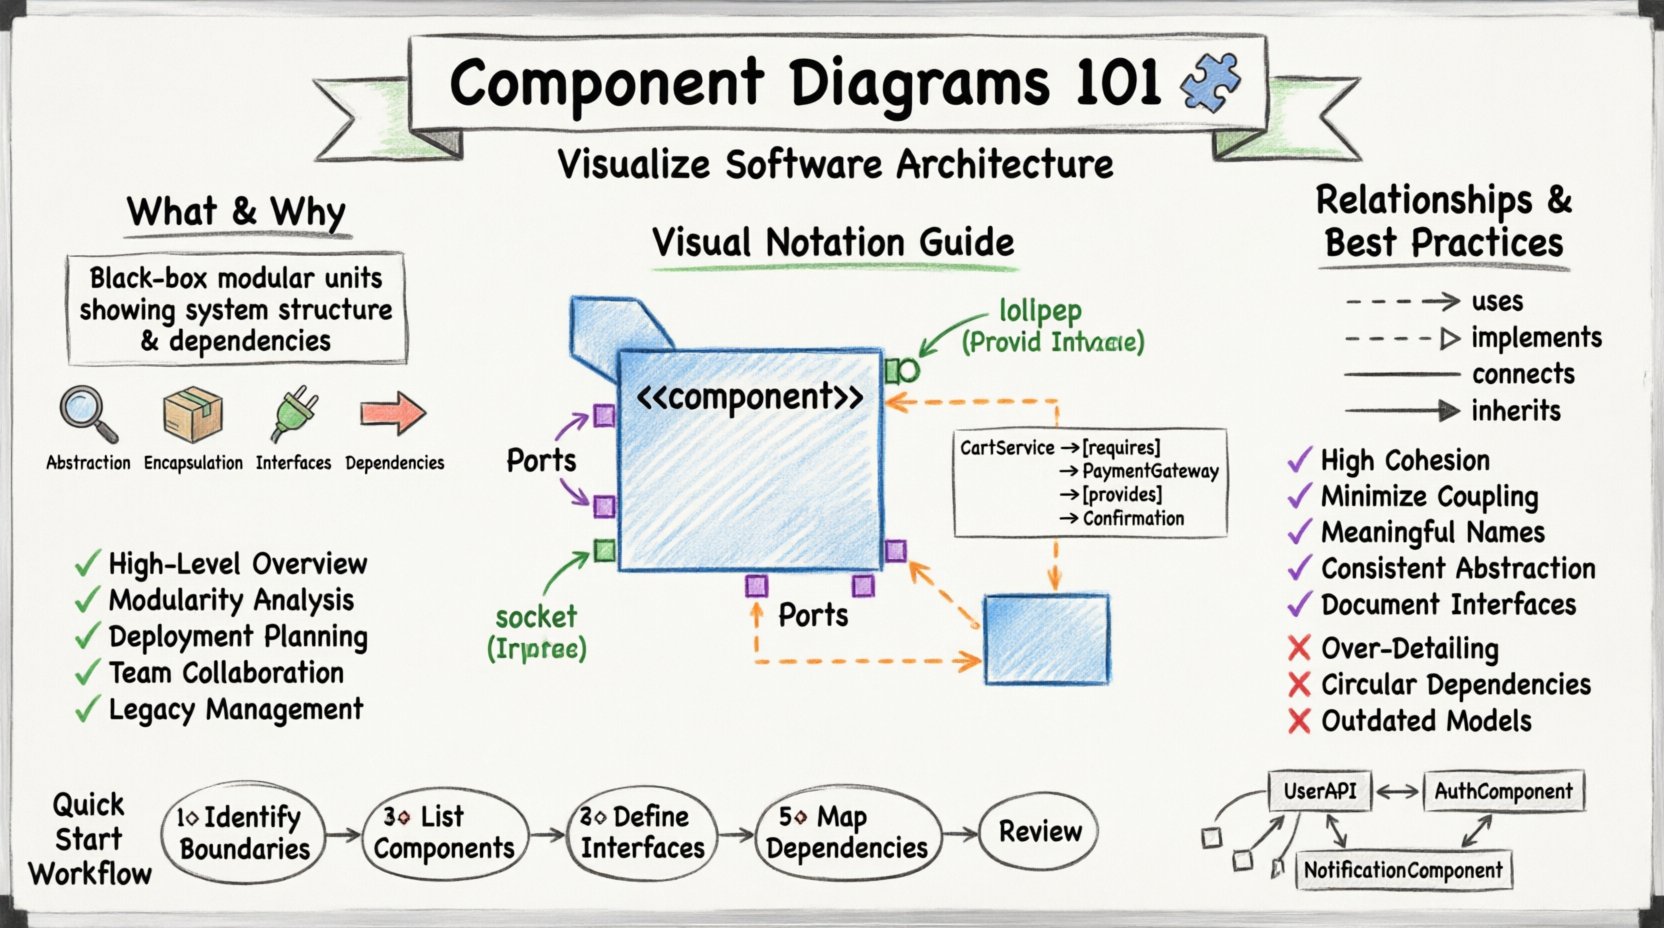
A component diagram is a type of Unified Modeling Language (UML) diagram that shows the organization and dependencies among a set of components within a system. Unlike class diagrams, which focus on the internal details of individual classes, component diagrams zoom out to show larger building blocks. These blocks represent physical or logical units of software that can be deployed, replaced, or updated independently.
Think of a component as a self-contained unit that provides specific functionality. It acts as a black box: you know what it does based on its interfaces, but you do not necessarily need to know how it works internally to use it. This separation of concerns is critical for managing complexity in large-scale projects.
Core Characteristics
- Abstraction: Components represent groups of related classes or subsystems.
- Encapsulation: Internal details are hidden from the outside world.
- Interfaces: Defined points of interaction with other components.
- Dependencies: Relationships indicating reliance on other components.
Why Use Component Diagrams? 📊
Visualizing architecture is not just about documentation; it is about communication and planning. Using component diagrams offers several tangible benefits for development teams and stakeholders.
- High-Level Overview: Stakeholders can grasp the system structure without reading thousands of lines of code.
- Modularity Analysis: Architects can identify if the system is too coupled or if modules are too granular.
- Deployment Planning: Components often map to deployable units, helping in infrastructure planning.
- Team Collaboration: Different teams can work on specific components as long as interfaces remain stable.
- Legacy Management: Helps in understanding existing systems before refactoring or modernizing.
Key Elements and Notation 🎨
Understanding the visual language of component diagrams is essential for accurate modeling. While tools vary, the underlying notation remains consistent across industry standards.
1. The Component Icon
The primary symbol is a rectangle with a small tab on the top left corner. This shape represents a physical or logical unit. The name of the component is written inside the box. To indicate that it is a component rather than a class, the stereotype <<component>> is often placed above the name, though this is not always strictly required.
2. Interfaces
Interfaces define the contract between components. They specify what services a component provides or what services it requires. There are two main types:
- Provided Interface: Services the component offers to others. Visually, this is often a “lollipop” shape (a circle attached to a line).
- Required Interface: Services the component needs from others. Visually, this is a “socket” shape (a half-circle attached to a line).
3. Ports
Ports are specific points on a component where interactions occur. They act as connectors between the component and its environment. A component can have multiple ports, each connecting to different interfaces. This allows a single component to interact with various other parts of the system simultaneously.
4. Connectors
Connectors represent the relationships between components. They show how data or control flows between modules. These can be physical wires in hardware contexts or logical links in software contexts.
Types of Relationships 🔄
Relationships define how components interact. Understanding these connections is vital for analyzing system stability and change propagation.
| Relationship Type | Visual Symbol | Meaning |
|---|---|---|
| Dependency | Dashed arrow | One component relies on another. Changes in the dependency may affect the dependent. |
| Realization | Dashed line with hollow triangle | A component implements an interface defined by another component. |
| Association | Solid line | A structural link indicating that instances of one component are connected to instances of another. |
| Generalization | Solid line with hollow triangle | One component is a specialized version of another (inheritance). |
Dependency is the most common relationship in component modeling. It indicates that a component uses the functionality of another. For example, a Payment Component might depend on a Notification Component to send confirmation emails. If the Notification Component changes its API, the Payment Component must adapt.
Realization is crucial for interface-based design. It shows that a component fulfills a contract. This supports loose coupling, as the component does not need to know the identity of the provider, only the interface it must implement.
Interfaces and Ports in Detail 🔌
The interaction between components is governed by interfaces and ports. This is where the “black box” concept becomes practical.
Provided vs. Required
Components rarely exist in isolation. They must provide value to the system and consume value from others. The distinction between providing and requiring is key to defining boundaries.
- Provided: “I can do this for you.” The component exposes methods or services that other components can call.
- Required: “I need this to work.” The component expects other parts of the system to fulfill specific roles.
Binding Interfaces
When a component requires an interface, another component must provide it. This binding can be explicit or implicit. In explicit binding, the diagram clearly shows which component satisfies the requirement. In implicit binding, the system resolves the connection automatically, often handled by a framework or container.
When to Use Component Diagrams 📅
While powerful, these diagrams are not needed for every project. Knowing when to apply them saves time and reduces clutter.
Appropriate Scenarios
- Large-Scale Systems: When the system is too complex for a single class diagram.
- Microservices Architecture: To visualize service boundaries and API contracts.
- Plugin Systems: When designing extensible software where modules are added dynamically.
- Legacy Migration: To document the current state before refactoring.
- Team Handoff: When transferring ownership of a subsystem between teams.
When to Avoid
- Small Scripts: Simple applications do not require architectural diagrams.
- Highly Dynamic Systems: If components change at runtime frequently, static diagrams may become outdated quickly.
- Early Conceptualization: Sometimes a use case diagram or user story is better for initial requirements gathering.
Best Practices for Modeling 🛠️
To ensure component diagrams remain useful and readable, follow these established guidelines.
1. Maintain High Cohesion
Each component should focus on a single responsibility. If a component does too many things, it becomes difficult to maintain and test. Group related functionalities together.
2. Minimize Coupling
Reduce dependencies between components. High coupling makes changes risky. If Component A depends on Component B, changing B might break A. Use interfaces to mediate these connections.
3. Use Meaningful Names
Labels should be clear and descriptive. Avoid abbreviations that are not standard. A component named “DataMgr” is less clear than “DataRepository”.
4. Keep Levels Consistent
Do not mix high-level subsystems with low-level classes in the same diagram. Maintain a consistent level of abstraction throughout the model.
5. Document Interfaces
Interfaces are the public face of a component. Document the operations they support. This helps developers integrate without reading internal code.
Common Mistakes to Avoid ❌
Even experienced architects can fall into traps when creating these diagrams. Awareness of common pitfalls helps ensure quality.
- Over-Detailing: Including too many attributes or methods inside the component box turns it into a class diagram.
- Ignoring Interfaces: Showing direct connections between components without interface mediation hides the true dependencies.
- Circular Dependencies: If Component A depends on B, and B depends on A, it creates a cycle that is hard to resolve.
- Inconsistent Notation: Using different shapes for the same element confuses readers.
- Outdated Models: Failing to update the diagram after code changes renders it useless.
Integration with Other Diagrams 🧩
Component diagrams do not exist in a vacuum. They complement other UML diagrams to provide a complete picture of the system.
Class Diagrams
Class diagrams detail the internal structure of a component. A component diagram shows the box; the class diagram shows the contents. Use both together for comprehensive design.
Deployment Diagrams
Deployment diagrams show where components run physically. Once you know what components exist, deployment diagrams show which server or node hosts them.
Sequence Diagrams
Sequence diagrams show how components interact over time. They provide the dynamic view that complements the static structure of the component diagram.
Step-by-Step Creation Process 📝
Creating a diagram requires a methodical approach. Follow these steps to ensure a structured outcome.
- Identify Boundaries: Define the system scope. What is inside and what is outside?
- List Components: Brainstorm the major functional units. Group related classes into these units.
- Define Interfaces: Determine what each component provides and requires.
- Map Dependencies: Draw lines to show relationships between components.
- Refine Notation: Ensure all symbols follow the standard conventions.
- Review: Check for circular dependencies, missing interfaces, or unclear labels.
Real-World Application Examples 💡
Seeing these concepts in action helps solidify understanding. Consider the following scenarios.
Example 1: E-Commerce System
A typical e-commerce platform can be broken down into components such as CartService, OrderProcessor, PaymentGateway, and InventoryManager. The OrderProcessor requires the PaymentGateway interface to complete transactions. It depends on the InventoryManager to check stock levels. This structure allows the payment team to update their gateway without affecting the inventory team.
Example 2: Microservices Architecture
In a microservices environment, each service is a component. The UserAPI component communicates with the AuthComponent for login verification. A message queue acts as an interface for asynchronous communication between the OrderComponent and the NotificationComponent. This decoupling ensures that if the notification service goes down, orders can still be placed.
Conclusion 🏁
Component diagrams are a foundational tool for software architects and developers. They provide the necessary structure to manage complexity, facilitate communication, and guide implementation. By understanding the elements, relationships, and best practices outlined here, you can create models that serve as reliable blueprints for your projects. Remember that diagrams are living documents; they should evolve alongside your code to remain accurate and valuable. With a clear understanding of components, you can design systems that are modular, scalable, and maintainable for the long term.

